
V. M. Cristiana Moliterni,† Paolo Ranalli† and Giuseppe Mandolino†,2
– Manuscript received April 23, 2002
– Accepted for publication October 16, 2002
ABSTRACT
 Four crosses were made between inbred Cannabis sativa plants with pure cannabidiol (CBD) and pure delta-9 tetrahydrocannabinol (THC) chemotypes. All the plants belonging to the F1’s were analyzed by gas chromatography for cannabinoid composition and constantly found to have a mixed CBD-THC chemotype. Ten individual F1 plants were self-fertilized, and 10 inbred F2 offspring were collected and analyzed. In all cases, a segregation of the three chemotypes (pure CBD, mixed CBD-THC, and pure THC) fitting a 1:2:1 proportion was observed. The CBD/THC ratio was found to be significantly progeny specific and transmitted from each F1 to the F2’s derived from it. A model involving one locus, B, with two alleles, BD and BT, is proposed, with the two alleles being codominant. The mixed chemotypes are interpreted as due to the genotype BD/BT at the B locus, while the pure-chemotype plants are due to homozygosity at the B locus (either BD/BD or BT/BT). It is suggested that such codominance is due to the codification by the two alleles for different isoforms of the same synthase, having different specificity for the conversion of the common precursor cannabigerol into CBD or THC, respectively. The F2 segregating groups were used in a bulk segregant analysis of the pooled DNAs for screening RAPD primers; three chemotype- associated markers are described, one of which has been transformed in a sequence-characterized amplified region (SCAR) marker and shows tight linkage to the chemotype and codominance.
Small and Beckstead (1973) were the first to systematically survey a wide number of Cannabis accessions for variability in cannabinoid composition. They recognized, on a population mean basis, three chemical phenotypes (chemotypes): chemotype I, with a THC content ?0.3% and a CBD content ?0.5% of the inflo- rescence dry matter; an intermediate chemotype II, with CBD as the prevalent cannabinoid but also THC present at various concentrations; and a chemotype III, with particularly low THC content. These chemotypes were presumed to be associated mainly to geographical prov- enance. No studies on the respective roles of heredity and environment on the chemotype expression were performed. Tripartite patterns of CBD/THC ratio distributions were recognized within populations by Four- nier and Paris (1979) and by Fournier (1981). De Meijer et al. (1992), in a survey of a large Cannabis collection, also found that plants belonging to the same population often show distinct CBD/THC ratios. A rare, additional chemotype, characterized by a very low content of both THC and CBD and with CBG as the predom- inant constituent, was later identified by Fournier et al. (1987).
The first specific step in cannabinoid biosynthesis is the condensation reaction of geranylpyrophosphate (GPP) with the polyketide, olivetolic acid (OA), which is catalyzed by the enzyme geranylpyrophosphate:olivetolate geranyltransferase (GOT; Fellermeier and Zenk 1998; Fellermeier et al. 2001). The resulting CBG is the direct precursor for CBD (Taura et al. 1996) and CBC (Gaoni and Mechoulam 1966; Morimoto et al., 1997, 1998). In older references THC was considered a further cyclization product of CBD (Shoyama et al. 1974). Later, Fournier and Paris (1980) assumed that this pathway, CBG → CBD → THC, was characteristic for fiber strains only. For drug strains, which are often devoid of even trace amounts of CBD, the direct conversion of CBG into THC was supposed to be typical. Today, THC is considered to be derived directly from CBG in all Cannabis strains (Figure 1b); the existence of the postulated enzyme CBD-cyclase catalyzing the synthesis of THC via CBD has not been experimentally confirmed (Taura et al. 1995). The propyl homolog of CBG, i.e., CBGV, is formed if a C10, instead of the common C12 version of OA, condenses with GPP (Shoyama et al. 1984; Fellermeier and Zenk 1998). The in vivo conver- sions of CBG(V) into the end products THC(V), CBD(V), and CBC(V) are enzymatically catalyzed, and for each reaction an enzyme has been identified: THC synthase (Taura et al. 1995), CBD synthase (Taura et al. 1996), and CBC synthase (Morimoto et al. 1998). Shoyama et al. (1984) demonstrated that an enzyme extract from a Cannabis strain containing CBD and THC is able to convert CBGV into THCV and CBDV. This last finding implies that THC, CBD, and probably also CBC synthase, are able to process homologs of CBG regardless of the length of their alkyl side chain.
Quantitative and qualitative aspects of cannabinoid accumulation are often confused as pointed out by Hillig (2002) in a critical comment on Sytnik and Stelmah (1999). To specify the target of the current article it is adequate to express the yield of a certain cannabinoid per crop area unit as a complex trait,
 (1)
(1)where CYn is the yield of cannabinoid, n (grams per square meter); DM is the total amount of dry, above ground biomass (grams per square meter); Pflor is the weight proportion of inflorescence leaves and bracts (grams per gram); Ctot is the total cannabinoid content in the inflorescence leaves and bract fraction (grams per gram); and PCn is “purity,” the proportion of cannabinoid n in the total cannabinoid fraction (grams per gram).
Fournier and Paris (1979, 1980) and Fournier (1981) reported a clear-cut segregation for CBD/THC ratios within French fiber cultivars. Two groups could be distinguished in a ratio of 1:4, the first one composed of plants with mixed CBD-THC profiles and the other of plants with fairly pure CBD profiles. Yotoriyama et al. (1980) analyzed the F2 from F1 hybrids containing both CBD and THC in similar amounts and found segregation of the chemotypes with pure CBD, mixed CBD- THC, and pure THC profiles in a 1:2:1 ratio. The subsequent generations of the pure CBD plants were further investigated and they showed a fixed CBD chemotype. Becu et al. (1998) evaluated a segregating F2 and sup- posed a monogenic inheritance of THC and CBD ratios. This was not confirmed by other authors (Sytnik and Stelmah 1999).
DNA markers in Cannabis: Today, the concept of Cannabis as a monotypic genus is widely accepted; taxonomical, morphological, and biometrical studies confirm the continuity of its gene pool despite the extremely high variation found within and between populations (Small et al. 1976; de Meijer and Keizer 1996). In the last few years, the existence of just a single species within the genus has been confirmed by molecular marker studies that show a limited segregation of the different groups within the genus Cannabis and an extremely high degree of polymorphism, estimated to be of the same magnitude within and between populations (Faeti et al. 1996; Forapani et al. 2001). Within some of the best-known hemp cultivars, e.g., Carmagnola, the degree of polymorphism was estimated by ran- domly amplified polymorphic DNA (RAPD) markers to involve ?80% of the markers scored, and the data suggested a huge reservoir of variation within even the most selected Cannabis strains considered during the study. Finally, within the dioecious populations, the presence of a high number of male-specific markers, presumably associated with the Y chromosome, was found by RAPD and amplified fragment length polymorphism analysis (Mandolino et al. 1999, 2002; Flachowsky et al. 2001).
Chemotype assessment: Mature floral clusters were col- lected from each and every individual plant. The flower clus- ters were air dried, and 50 mg of leafy material was weighed in a filtration tube (Ultrafree-CL, 0.1 ?m; Millipore, Bedford, MA). The following steps were then repeated four times: 1 ml of ethanol (99.7%) was added, the sample was sonicated in ethanol for 15 min, and the extract was centrifuged at 4000 rpm for 10 min. Then, the total 4 ml of ethanol con- taining the extracted cannabinoids was transferred from the filtration tube to a 5-ml volumetric flask; 0.25 ml of a phenanthrene stock solution (10 mg/ml in ethanol) was added as internal standard and the volume was adjusted to 5 ml with ethanol. Finally, extracts were homogenized and transferred to GC vials. Gas-chromatographic analyses were performed on a Hewlett-Packard 6890 GC equipped with an autosampler and a flame ionization detector. Two columns were used: the (slightly polar) HP-5, 320 ?m ? 30 m, with 0.25-?m film for general quantitative analysis of larger sample loads, and the nonpolar HP-1, 100 ?m ? 40 m, with 0.20-?m film for an accurate separation of CBD from CBC. Average moisture content per progeny studied was determined by drying samples of the floral material at 105? for 3 hr. Moisture correction factors and a linear calibration equation, obtained with a CBD concentration range, were used to convert GC-derived peak areas to dry weight concentrations. Compound identities were determined by matching retention times with those of pure standards.
Constitution of inbred lines: All parentals used in this study were doubly inbred plants (S2’s) obtained through the self-fertilization of selected female clones from the Cannabis col- lection of HortaPharm B.V., The Netherlands. The original plants had either CBD or THC as the predominant canna- binoid. The 00.45.1 clone was an exception, having both CBD and THC in similar amounts. The clones were obtained through in vivo propagation of lateral branches. An individual from each clone was partially sex reversed according to the procedure described by Mohan Ram and Sett (1982) and allowed to self-pollinate in isolation. In many cases it was possible to collect sufficient viable seed to constitute a first- generation inbred line (S1), which was completely female and showing the same chemotype as the parental clone. The 00.45.1 S1, however, segregated into pure CBD, mixed CBD- THC, and pure THC individuals. Here, further inbreeding was restricted to the pure CBD plants. An S2 generation was produced from some of the S1 plants, using the same proce- dure described above. The work focused on six S2 lines, briefly described in Table 1. A leaf sample was collected for DNA analysis from 10 to 20 plants per S2.
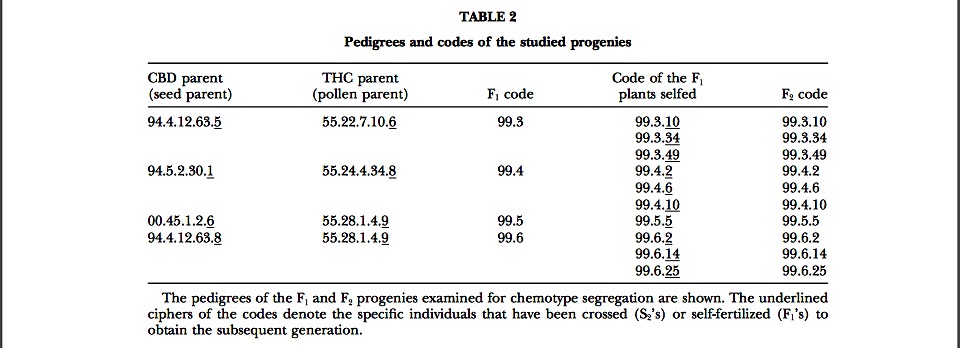
Production of F1’s and F2’s: Seven individual plants belong- ing to the six S2 lines with contrasting chemotypes were chosen to produce hybrid F1’s. The individual female plants used as pollen parents were partially sex reversed and placed in isolation cabinets with the seed parent plants. The crosses per- formed are summarized in Table 2.
Molecular analysis: From each leaf sample taken from S2, F1, and F2 individual plants, genomic DNA was prepared using the Nucleon Phytopure kit (Amersham Pharmacia Biotech, Buckinghamshire, UK). The DNA concentration of each sample was adjusted to 1 ?g/?l after 260-nm readings, and 20 ng were used for amplification reactions. RAPD analysis using decamer primers of random sequence (purchased from Operon Technologies, Alameda, CA, and the Nucleic Acid-Pro- tein Service Unit, Biotechnology Laboratory, University of British Columbia, Canada) and gel electrophoresis were con- ducted as described elsewhere (Faeti et al. 1996). For the analysis of S2 and F1 individuals, a matrix composed of 1’s and 0’s was obtained after scoring the RAPD bands reproducible after at least two rounds of amplifications of the same template. The number of loci and the polymorphism percentage were calculated on the basis of these matrices. F2 samples were analyzed by bulk segregant analysis (Michelmore et al. 1991); seven pairs of bulks were composed from the contrasting (CBD and THC) chemotypes of the F2’s by mixing equimolar amounts of DNA from 6–14 individual plants per chemotype for each of the seven progenies. The RAPD analysis of the bulked DNA samples was performed as described above for individual analysis. Single DNA bands differentiating the F2 bulks were eluted from the gel using the QIAquick gel extrac- tion kit (QIAGEN, Valencia, CA) and cloned in the pGEM-T vector system II (Promega, Madison, WI); Escherichia coli cells (strain JM109) were then transformed with the recombinant plasmid using the Gene Pulser electroporator (Bio-Rad, Richmond, CA ) and plated on suitable media. The positive clones were separately cultured, and the inserts were excised from the plasmid vector, labeled with [?-32P]dCTP according to Feinberg and Vogelstein (1983), and used as probes in Southern blot hybridization experiments of RAPD amplified products as described elsewhere (Mandolino et al. 1999), to check the identity of the cloned fragment with the original RAPD marker. Once the identity was confirmed, the DNA insert was sequenced using the BigDye Terminator cycle sequencing kit (Applied Biosystems, Foster City, CA) and the automatic sequencer AbiPrism 310 Genetic Analyzer (Applied Biosystems). From the sequences obtained, specific 20-mer primers were constructed and tested in PCR reactions carried out under the same conditions described elsewhere (Mandolino et al. 1999).
RESULTS
Variation in cannabinoid composition: Examples of Cannabis gas-chromatographic profiles are shown in Figure 1a. The variation found within accessions is usually at both levels of cannabinoid type (different retention times) and amount (different peak areas), confirming other authors’ observations (Small and Beckstead 1973; de Meijer et al. 1992). Plants with only a single dominant cannabinoid (THC or CBD in this study) are present as 95–98% of the total cannabinoid content (Figure 1a, top and middle chromatograms). Such plants are here termed as pure chemotypes and can be found naturally occurring within accessions or can be produced by crossing or self-fertilizing plants showing a mixed chemotype (Figure 1a, bottom chromatogram; see below).
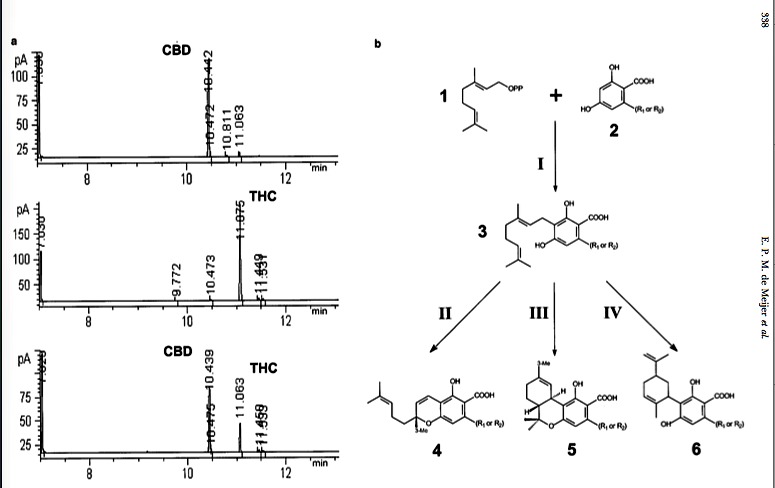
[Above]Figure 1.—(a) GC chromatograms of female individuals belonging to three different chemotypes (pure-CBD, pure-THC, and mixed chemotype) from different breeding lines are shown. The horizontal axis indicates the retention time and the vertical axis the detector signal (picoamps). CBD and THC peaks appear in the interval 10.439–10.442 and 11.063–11.075 min, respectively. (b) The biosynthetic pathway of cannabinoids is shown (modified after Fellermeier et al. 2001). 1, geranylpyrophosphate; 2, olivetolic acid; 3, CBG(V); 4, CBC(V); 5, THC(V); 6, CBD(V); I, geranylpyrophosphate:olivetolate geranyltransferase (GOT); II, CBC(V) synthase; III, THC(V) synthase; IV, CBD(V) synthase. R1 (? ?C3H7) and R2 (? ?C5H11) indicate the propyl and pentyl forms of the different metabolites.
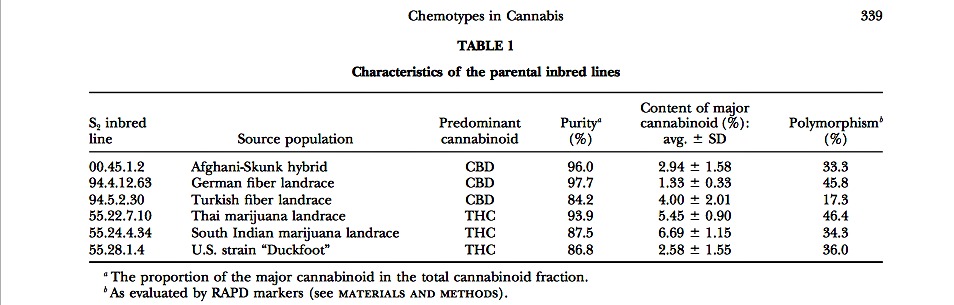
The molecular analysis performed on the S2 lines suggested a narrowing of the genetic variation within these materials, especially if compared with noninbred populations as examined previously (Forapani et al. 2001). The percentage of polymorphisms detectable by RAPD analysis (three primers) ranged from 17.3 to 46.4% (Table 1), while it was previously reported to be from 65 to 80% within the most common Italian and French fiber cultivars (Forapani et al. 2001).
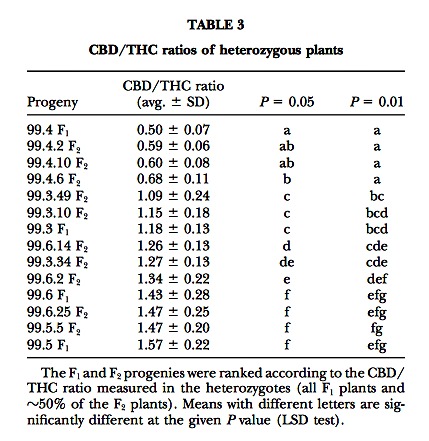
Surprisingly, the CBD/THC ratio appeared to vary in a clear progeny-specific way. The average ratio varied significantly (P ? 0.001) from 0.50 (F1 99.4) up to 1.57 (F1 99.5), where only four plants could be analyzed (Table 3).
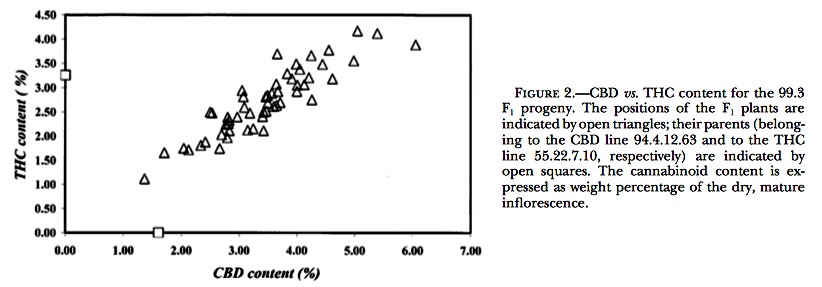
F2 inbreds: The CBD vs. THC contents of one of the F2’s examined are plotted in Figure 3. Within each F2, the individuals could unmistakably be assigned to three different segregant groups on the basis of large disconti- nuities in the calculated CBD/THC ratios. Data on the segregation of chemotypes in the different F2’s are shown in Table 4. For all F2’s, the results of the ?2 test accepted the model of a single locus with two codomi- nant alleles. In those F2’s where the segregation ratios deviated most from 1:2:1 (largest ?2 values), this was consistently due to an underrepresentation of pure CBD chemotypes.
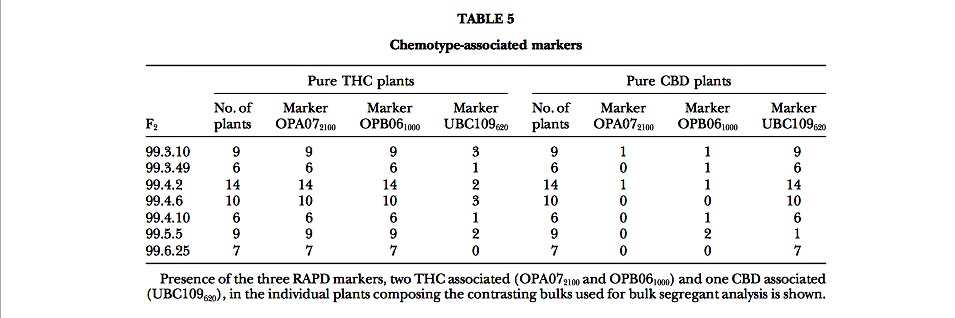
Molecular markers associated to chemotype: The clear-cut segregation observed in all the F2’s considered allowed the application of the bulk segregant analysis (BSA; Michelmore et al. 1991) strategy to find molecular markers linked to chemotype. Seven pairs of DNA bulks were made, corresponding to the F2 progenies 99.3.10, 99.3.49, 99.4.2, 99.4.6, 99.4.10, 99.5.5, and 99.6.25, and each was composed of 8–10 DNAs from the contrasting chemotype groups. Fifty RAPD primers were used to screen the seven bulks, and ?400 bands were scored. In several cases, bands discriminating one or more of the bulks were observed, but only three primers, OPA07 (5?-GAAACGGGTG-3?) and OPB06 (5?- TGCTCTGCCC-3?) from Operon Technologies and UBC109 (5?-TGTACGTGAC-3?) from the University of British Columbia, produced three bands, two THC and one CBD associated, discriminating six or seven pairs of DNA bulks. The CBD-associated band (UBC109620) was ?620 bp, while the two THC-associated markers (OPB061000 and OPA072100) were ?1000 and 2100 bp.
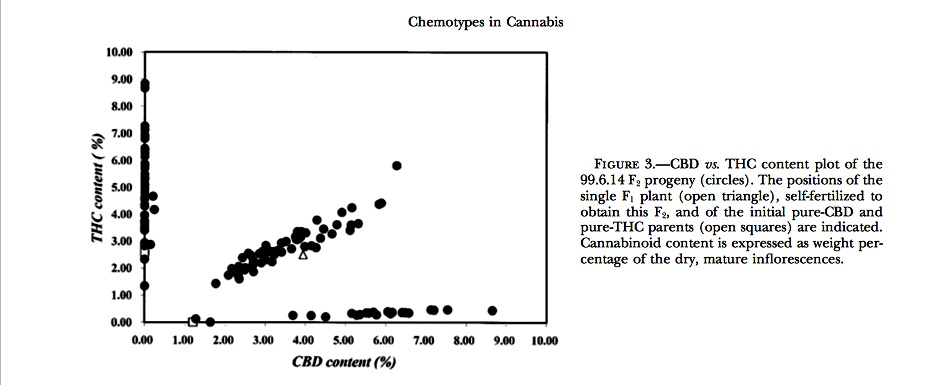
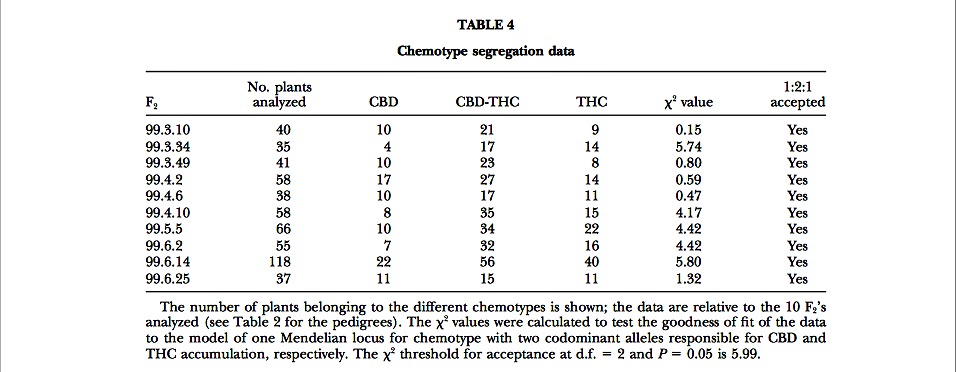
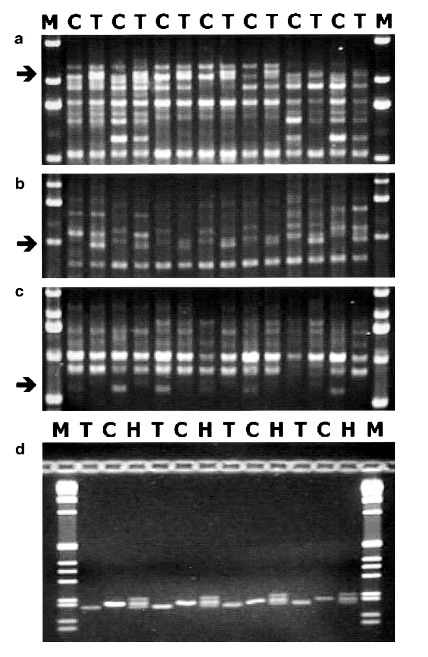
Figure 4.—Result of the amplification mediated by the three RAPD primers OPA07, OPB06, and UBC109 (a–c) on the bulked DNAs from THC (T) and CBD (C) segregants of the seven different F2’s listed in Table 5. The arrows indicate the two THC- (a and b) and the CBD- (c) specific DNA frag- ments. (d) The amplification produced by the SCAR marker obtained on the basis of the sequence of the THC-specific fragment shown in b; each lane shows the result of the amplification of DNA from single plants, pure THC (T), pure CBD (C), or mixed (H). M indicates the molecular weight marker (1-kb ladder; Life Technologies).
The uniformity of F1 chemotypes and the F2 segregation ratios demonstrate the presence of a single locus, which is referred to as B, showing simple Mendelian inheritance of the two alleles, BD and BT, evidenced by this study. The model proposes that a pure CBD plant has a BD/BD genotype at the B locus, while a pure THC plant has a BT/BT genotype. F1 and ?50% of the F2 plants are therefore heterozygous BD/BT, with the two alleles being codominant and therefore simultaneously expressed in the hybrids. The hypothesis of two alleles at one locus was accepted by ?2 tests for all the F2’s examined (Table 4). This model agrees with the assump- tion of a monogenic inheritance as expressed by Becu et al. (1998).
It should be acknowledged that these results may also be explained with the hypothesis of two duplicated loci, one encoding for a CBD synthase and the other for a THC synthase, mapping so closely that observation of linkage rupture was impossible in the progenies exam- ined. Such a situation was found in different cases of secondary metabolism genes where duplicated mem- bers encoded for enzymes catalyzing either consecutive metabolic steps or alternative reactions from a common precursor. In maize, a family of four duplicated genes (BX2–5) was shown to encode for cytochrome P450- dependent monooxygenases, each catalyzing one of the consecutive steps from indole to 2,4-dihydroxy-7-meth- oxy-1,4-benzoxazin-3-one (DIMBOA) synthesis (Frey et al. 1995; Glawischnig et al. 1999). In Arabidopsis, genes encoding for different 2-oxoglutarate-dependent dioxygenases (AOP1–3) were identified as responsible for the synthesis of different glucosinolates; these genes map to the same position and code for alternative reactions from a common precursor, leading to 3-hydroxy- propyl and 3-butenyl glucosinolate (Kliebenstein et al. 2001). These authors could also identify a recombinant inbred (RI) line endowed with null alleles, accumulat- ing the precursor 4-methylsulfinylbutyl glucosinolate. AOP genes were considered as duplicated, rather than as allelic, essentially on the basis of the presence of a cluster of candidate genes in the sequenced Arabidopsis genome. Besides, little homology was found between AOP and other genes, though a 60–70% sequence ho- mology was found among the cluster components. In the case of cannabinoid genes, however, although the possibility of the presence of duplicated genes cannot be ruled out on the basis of the presented experiments, the consequences of a model with duplicated loci should be examined. Had parental CBD lines carried defective alleles at the THC locus (thc/thc-CBD/CBD) and THC lines at the CBD locus (THC/THC-cbd/cbd), a similar, chemotypically uniform, F1 would have been found, as well as the same segregation of chemotypes in the F2. Theoretically the screening of wide populations should reveal the existence of fixed doubly dominant homozygous (THC/THC-CBD/CBD), showing both cannabinoids: these plants should not segregate on selfing. Such a situation has never been observed during several years of germplasm screening and selfing in the breeding programs. Further consideration suggests that if there were any chance of a cross that separated the two dupli- cated loci, then the CBG chemotype (thc/thc-cbd/cbd) should be found more frequently than has actually been observed. In fact, in populations where a high frequency of all the three chemotypes is found, as in hashish land- races, the recessive alleles cbd and thc should occur with significant frequency and, because Cannabis of necessity outbreeds, should have a good chance to occur in the homozygous state. Instead, CBG plants have been de- tected in fiber cultivars that, according to a two-locus model, should have a very high frequency of CBD and thc alleles. Therefore, even extremely low frequencies of the cbd allele should lead to frequent CBG chemotypes, due to the virtual absence of THC alleles in fiber hemp. Conversely, as yet only a few reports of single plants show the CBG chemotype (Fournier et al. 1987; G. Grassi and V. G. Virovets, personal communications), suggesting a very low frequency for this chemotype, despite the observation that the plants carrying defective alleles suffered no loss of vitality (G. Fournier, personal communication).
In those F2’s where the segregation ratios deviated most from 1:2:1 (largest ?2 values), this was consistently due to an underrepresentation of CBD homozygotes, possibly an effect of a recessive semilethal factor loosely associated with the BD allele. For the 99.3.34 F2, differen- tial seed viability and seedling survival could explain the lower proportion of CBD homozygotes. The other F2’s with higher ?2 values showed an insignificant loss of seeds and seedlings. The assumed semilethal factor in these progenies must therefore already be effective during embryogenesis. An additional indication of reduced viability of the BD /BD genotype is provided by the dra- matic drop of fertility in pure CBD plants during line selection, a phenomenon that is usually absent in THC inbreds (data not shown). Although one can expect most fiber cultivars to have the BD/BD genotype, to the best of our knowledge there are no reports on reduced viability and fertility of such strains, as compared with high-THC populations. However, only a chemotypically segregating population could provide proper evidence for such a phenomenon, as all other genetic traits contributing to viability and fertility need to be randomized among chemotype groups.
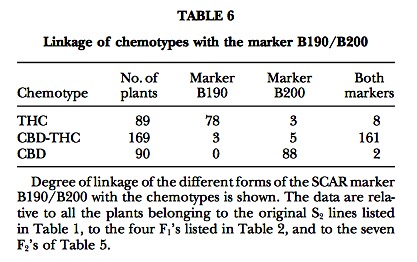
When working with young, vegetative plant materials, the molecular markers described may be more effective than GC chromatograms in genotyping plants for their chemotype. The RAPD markers originally identified were completely dominant, as expected from a PCR marker; however, the marker B190/B200, one of the SCAR markers developed on the basis of sequence infor- mation, behaves codominantly (Figure 4d). Both types of marker appear tightly linked to the chemotype in the pedigrees so far examined (Tables 5 and 6). The B190/B200 marker could be profitably employed in the breeding work, though at present we have no data on its utility beyond the specific crosses made in this study. The marker seems particularly suitable to distinguish pure CBD and heterozygous plants, which can be valu- able when counterselecting for THC chemotypes in fiber hemp breeding.
The synthesis of THC and CBD in Cannabis plants has been described as an oxidoreduction coupled to a cyclization of CBG, catalyzed by a THC and a CBD synthase, respectively. A CBC synthase has also been described, catalyzing a similar reaction leading to CBC. These enzymes were isolated from different drug or fiber strains, and many of their characteristics were elu- cidated. Most of the properties of CBD and THC synthase were very similar, like the mass (75 kD), the exis- tence as a monomer localized in the cytosol, the pI, the optimum pH, the rate constant kcat, the Vmax, and the Km for their substrate. Also, the NH2-terminal sequence of the two synthases shared 87% of identity (Taura et al. 1995, 1996). The properties described for CBC synthase (Morimoto et al. 1998) were quite different; this en- zyme showed a lower Km (23 ?m instead of 134 and 137 ?m of the other two synthases), a lower turnover number (kcat ? 0.04 s?1 against 0.19 and 0.20 of CBD and THC synthase). It can be hypothesized that each of the alleles identified in this work, i.e., BD and BT, codes for an isoform of the same enzyme, showing specificity for the conversion of CBG to CBD or THC, respectively. In the heterozygous state, both isoforms would be present and therefore both conversions would occur, in accordance with the mixed chemotypes observed in the F1’s and in one-half of the F2 plants. This hypothesis, presented here for the first time, is also supported by the recent publication of the cDNA sequence of the CBD and THC synthases; the two sequences share 89% identity, and the longest nonmatching stretch is four nucleotides. The fact that, according to Taura et al. (1995, 1996), the two synthases have very similar affinities for CBG would theoretically result in CBD/THC ratios close to 1.0 in BD/BT genotypes. It is intriguing that the different parental combinations examined in our experiments show different CBD/THC ratios in the resulting F1 hy- brid, often strongly deviating from 1.0 and fairly stably inherited by the F2 heterozygotes (Table 3). Some heri- table factor seems to affect the balance between CBD and THC synthase in their competition to convert the CBG precursor. Had this factor been at a different locus, segregation for the CBD/THC ratio in the F2’s should be observed. However, as shown in Figure 3, within an F2 progeny there is no evidence of several heterozygous clusters with distinct slopes. It is therefore possible that BD and BT are part of a wider allelic series, coding for several isoenzymatic forms of CBD synthase and THC synthase, respectively, with differential affinities for the CBG substrate, resulting in significantly different CBD/ THC ratios in heterozygotes. When two homozygous parents are crossed, one with a certain isoform of CBD synthase, the other with a certain isoform of THC synthase, the CBD/THC ratio in the F1’s will depend on the balance between the efficiencies of the two synthases and will remain fixed in any further heterozygous descendant obtained through self-fertilization.
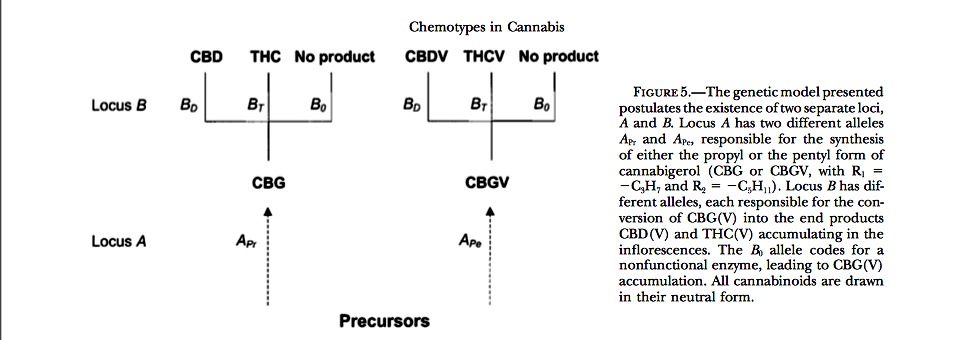
In the materials studied, the proportions of both CBD and THC reached at best ?96–98% of the total cannabinoid fraction. Generally, even after five cycles of in- breeding selection aimed at one target cannabinoid, at least a 2–4% impurity consisting of other cannabinoids remains. Therefore, the alleles postulated here, even in homozygous genotypes, seem to have an imperfect control over the biosynthetic events. Apparently, any of the postulated isoenzymatic forms encoded by the al- leles at the B locus show a residual ability to convert the precursor CBG(V) into cannabinoids other than the major one.
The existence of a single locus determining the chemotype, with at least two alleles, gives a clear genetic meaning to the tripartite distribution of the chemotypes within populations, as observed by several authors when CBD vs. THC content plots are considered (Fournier and Paris 1979; Fournier 1981; de Meijer et al. 1992). According to our model, these plots do not merely show phenotypic distributions, but rather they visualize the allele frequency within a population. It should be possi- ble to study the frequencies of the BD and BT alleles and their changes during time as a function of the population structure, the action of environmental conditions, and the different fitness values carried by them. A further consequence of the fact that CBD vs. THC plots actually are to be considered allele distribution plots is that no barriers between the different chemotypes of Cannabis can be postulated. The plants that are differently distributed in a CBD vs. THC plot have no large genetic differences, only different alleles at one single locus. Therefore, the commonly practiced application of chemotype as a taxonomic criterion is very disputable. Probably a polygenic character, such as the total cannabinoid content, is better balanced and preserved in populations and hence is a more robust criterion with which to discriminate subspecific taxa.
We gratefully acknowledge the plant breeding and chemical-analytical assistance of Tina Ent (Horta Pharm B.V.) and Kathy Hammond (GW Pharmaceuticals plc.) for text revision. This work was funded in part by the Italian Ministry of Agriculture and Forestry in the framework of the project “Induction of phenotypic markers and im- provement of common hemp.”
Becu, D. M. S., H. D. Mastebroek and H. J. P. Marvin, 1998
ing for root knot nematode resistance in hemp. Proceedings of Bast Fibrous Plants Today and Tomorrow, St. Petersburg, Russia, p. 149.
Bo ́csa, I., P. Mathe ́ and L. Hangyel, 1997 Effect of nitrogen on tetrahydrocannabinol (THC) content in hemp (Cannabis sativa L.) leaves at different positions. J. Int. Hemp Assoc. 4: 80–81.
de Meijer, E. P. M., and L. C. P. Keizer, 1996 Patterns of diversity in Cannabis. Genet. Res. Crop Evol. 43: 41–52.
de Meijer, E. P. M., H. J. van der Kamp and F. A. van Eeuwijk, 1992 Characterisation of Cannabis accessions with regard to can- nabinoid content in relation to other plant characters. Euphytica 62: 187–200.
de Zeeuw, R. A., Th. M. Malingre and F. W. H. M. Merkus, 1972a Tetrahydrocannabinolic acid, an important component in the evaluation of Cannabis products. J. Pharm. Pharmacol. 24: 1–6.
de Zeeuw, R. A., J. Wijsbek, D. D. Breimer, T. B. Vree, C. A. Van Ginneken et al., 1972b Cannabinoids with a propyl side chain in Cannabis. Occurrence and chromatographic behaviour. Science 175: 778–779.
Faeti, V., G. Mandolino and P. Ranalli, 1996 Genetic diversity of Cannabis sativa germplasm based on RAPD markers. Plant Breed. 115: 367–370.
Feinberg, A. P., and B. Vogelstein, 1983 A technique for radiola- beling DNA restriction endonuclease fragments to high specific activities. Anal. Biochem. 132: 6–13.
Fellermeier, M., and M. H. Zenk, 1998 Prenylation of olivetolate by a hemp transferase yields cannabigerolic acid, the precursor of tetrahydrocannabinol. FEBS Lett. 427: 283–285.
Fellermeier, M., W. Eisenreich, A. Bacher and M. H. Zenk, 2001 Biosynthesis of cannabinoids. Incorporation experiments with 13C-labeled glucoses. Eur. J. Biochem. 268: 1596–1604.
Flachowsky, H., E. Schumann, W. E. Weber and A. Peil, 2001 Ap- plication of AFLP for the detection of sex-specific markers in hemp. Plant Breed. 120: 305–309.
Forapani, S., A. Carboni, C. Paoletti, V. M. C. Moliterni, P. Ranalli et al., 2001 Comparison of hemp (Cannabis sativa L.) varieties using RAPD markers. Crop Sci. 41: 1682–1689.
Fournier, G., 1981 Les chemiotypes du chanvre (Cannabis sativa L.). Inte ́reˆt pour un programme de se ́lection. Agronomie 1: 679–688. Fournier, G., and M. R. Paris, 1979 Le chanvre papetier (Cannabis sativa L.) cultive ́ en France: le point sur ses constituants. Plant.
Med. Phytother. 13: 116–121.
Fournier, G., and M. Paris, 1980 De ́termination de chimiotypes
a` partir des cannabino ̈ıdes chez le chanvre a` fibres mono ̈ıque (Cannabis sativa L.). Possibilite ́s de se ́lection. Physiol. Veg. 18: 349–356.
Fournier, G., C. Richez-Dumanois, J. Duvezin, J.-P. Mathieu and M. Paris, 1987 Identification of a new chemotype in Cannabis sativa: cannabigerol-dominant plants, biogenetic and agronomic prospects. Plant. Med. 53: 277–280.
Frey, M., R. Kleim, H. Saedler and A. Gierl, 1995 Expression of a cytochrome P450 gene family in maize. Mol. Gen. Genet. 246: 100–109.
Gaoni, Y., and R. Mechoulam, 1966 Cannabichromene, a new ac- tive principle in hashish. Chem. Commun. 1: 20–21.
Glawischnig, E., S. Gru ̈ n, M. Frey and A. Gierl, 1999 Cytochrome P450 monooxygenases of DIBOA biosynthesis: specificity and conservation among grasses. Phytochemistry 50: 925–930.
Hammond, C. T., and P. G. Mahlberg, 1977 Morphogenesis of capitate glandular hairs of Cannabis sativa (Cannabaceae). Am. J. Bot. 64: 1023–1031.
Hillig, K., 2002 Letter to the editor. J. Ind. Hemp 7: 5–6. Holley, J. H., K. W. Hadley and C. E. Turner, 1975 Constituents
samples of known geographical origin. J. Pharm. Sci. 64: 892–894. Horkay, E., 1986 Establishing the share of self- and cross fertilisation by means of population genetics in a monoecious hemp stand.
No ̈ve ́nytermele ́s 35: 177–182 (in Hungarian).
Kliebenstein, D. J., V. M. Lambrix, M. Reichelt, J. Gershenzon
and T. Mitchell-Olds, 2001 Gene duplication in the diversifi- cation of secondary metabolism: tandem 2-oxoglutarate-depen- dent dioxygenases control glucosinolate biosynthesis in Arabi- dopsis. Plant Cell 13: 681–693.
Lydon, J., A. H. Teramura and C. B. Coffman, 1987 UV-B radiation effects on photosynthesis, growth and cannabinoid production of two Cannabis sativa chemotypes. Photochem. Photobiol. 46: 201–206.
Mandolino, G., A. Carboni, S. Forapani, V. Faeti and P. Ranalli, 1999 Identification of DNA markers linked to the male sex in dioecious hemp (Cannabis sativa L.). Theor. Appl. Genet. 98: 86–92.
Mandolino, G., A. Carboni, M. Bagatta, V. M. C. Moliterni and P. Ranalli, 2002 Occurrence and frequency of putatively Y chromosome linked DNA markers in Cannabis sativa L. Euphytica 126: 211–218.
Mechoulam, R., 1970 Marijuana chemistry. Science 168: 1159– 1166.
Michelmore, R. W., I. Paran and R. V. Kesseli, 1991 Identification of markers linked to disease-resistance genes by bulked segregant analysis: a rapid method to detect markers in specific genomic regions by using segregating populations. Proc. Natl. Acad. Sci. USA 88: 9828–9832.
Mohan Ram, H. Y., and R. Sett, 1982 Induction of fertile male flowers in genetically female Cannabis sativa plants by silver nitrate and silver thiosulphate anionic complex. Theor. Appl. Genet. 62: 369–375.
Morimoto, S., K. Komatsu, F. Taura and Y. Shoyama, 1997 Enzy- mological evidence for cannabichromenic acid biosynthesis. J. Nat. Prod. 60: 854–857.
Morimoto, S., K. Komatsu, F. Taura and Y. Shoyama, 1998 Purifi- cation and characterization of cannabichromenic acid synthase from Cannabis sativa. Phytochemistry 49: 1525–1529.
Shoyama, Y., M. Yagi and I. Nishioka, 1974 Biosynthesis of canna- binoid acids. Phytochemistry 14: 2189–2192.
Shoyama, Y., H. Hirano and I. Nishioka, 1984 Biosynthesis of propyl cannabinoid acid and its biosynthetic relationship with pentyl and methyl cannabinoid acids. Phytochemistry 23: 1909– 1912.
Small, E., and H. D. Beckstead, 1973 Common cannabinoid phe- notypes in 350 stocks of Cannabis. Lloydia 36: 144–165.
Small, E., P. Y. Jui and L. P. Lefkovitch, 1976 A numerical taxon- omy analysis of Cannabis with special reference to species delimita- tion. Syst. Bot. 1: 67–84.
Sytnik, V. P., and A. F. Stelmah, 1999 The character of inheritance of differences in cannabinoid content in hemp (Cannabis sativa L.). J. Ind. Hemp Assoc. 6: 8–9.
Taura, F., S. Morimoto and Y. Shoyama, 1995 First direct evi- dence for the mechanism of delta-1-tetrahydrocannabinolic acid biosynthesis. J. Am. Chem. Soc. 38: 9766–9767.
Taura, F., S. Morimoto and Y. Shoyama, 1996 Purification and characterization of cannabidiolic-acid synthase from Cannabis sat- iva L. J. Biol. Chem. 271: 17411–17416.
Yotoriyama, M., I. Ito, D. Takashima, Y. Shoyama and I. Nishioka, 1980 Breeding of Cannabis. Determination of cannabinoids by high-pressure liquid chromatography. Yakugaku Zasshi 100: 611–614.
Communicating editor: C. S. Gasser