 Endocannabinoids – Anandamide and 2- Arachidonoylglycerol are Substrates for Human Cytochrome P450 2J2 Epoxygenase.
Abstract
The American Society for Pharmacology and Experimental Therapeutics.
KEYWORDS:
CYP2J; NADPH cytochrome P450 reductase; P450 mechanism; anandamide; arachidonic acid; cardiovascular disease; enzyme kinetics; heme oxygenases; membrane-protein interactions
- PMID:
25277139
[PubMed – as supplied by publisher]
LinkOut – more resources
Full Text Sources
![]()
AA: arachidonic acid
AEA: anandamide
AEA-d4: deuterated anandamide
2-AG: 2-arachidonoylglycerol
EETs: epoxyeicosatrienoic acids
EET-EAs: epoxyeicosatrienoic ethanolamide EET-G: epoxyeicosatrienoic glycerol
CB1: cannabinoid receptor 1
CB2: cannabinoid receptor 2
MS-PPOH: N-(methylsulfonyl)-2-(2-propynyloxy)-benzenehexanamide
POPC: 1-palmitoyl-2-oleoyl-sn-glycero-3-phosphocholine
POPS: 1-hexadecanoyl-2-(9Z-octadecenoyl)-sn-glycero-3-phospho-L serine
PIP2: 1-heptadecanoyl-2-arachidonoyl-sn-glycero-3-[phosphoinositol-4′,5′-bisphosphate] 16,17-EpDPE: (±)16(17)-epoxy-4Z,7Z,10Z,13Z,19Z-docosapentaenoic acid
CPR: cytochrome P450 reductase
Section Assignment: Metabolism, Transport, and Pharmacogenomics
 Introduction
The human body contains endogenous cannabinoids (endocannabinoids) that elicit similar effects as 9-tetrahydrocanabinol (THC), the principal component of cannabis. The two most well characterized endocannabinoids are anandamide (AEA) and 2-arachidonylglycerol (2-AG) that primarily exert their effects by activating the cannabinoid receptors – cannabinoid receptor 1 (CB1) and cannabinoid receptor 2 (CB2). Dysregulation of the endocannabinoids have been implicated in a wide range pathologies including anxiety disorders, neurodegenerative diseases, obesity and heart disease (Kogan and Mechoulam, 2007). Therefore, a thorough understanding of all the potential metabolic pathways in the body is necessary to potentially target and alter these pathophysiological conditions.
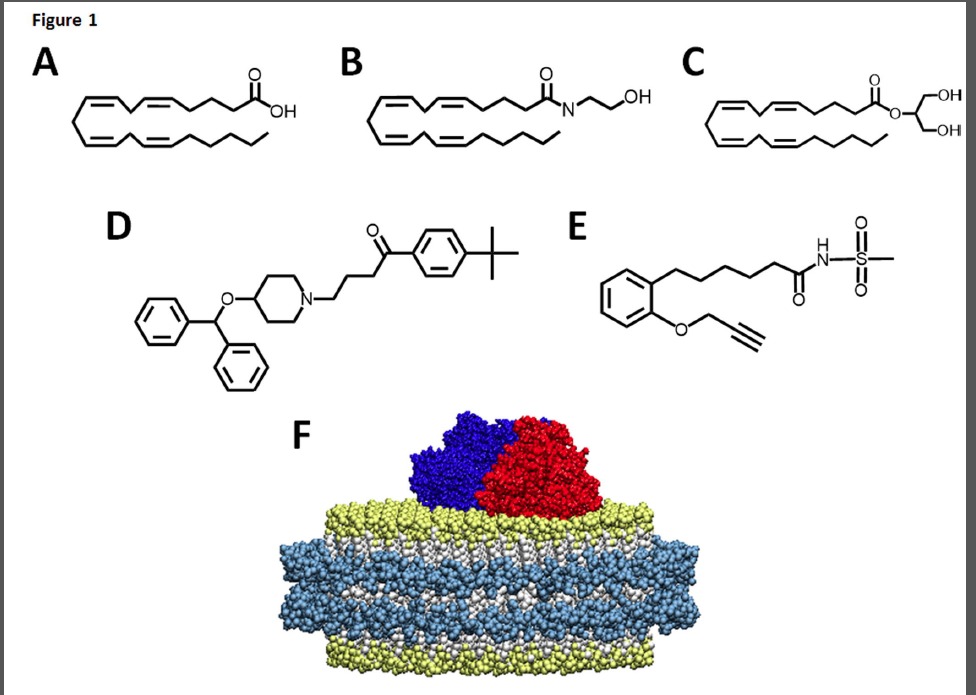
Endocannabinoids are derivatives of arachidonic acid (AA) that are stored in the plasma membrane (Fig. 1). AA is the primary substrate for the eicosanoid synthesizing cascade that includes three branches -the cyclooxygenase (COX), lipoxygenase (LOX) and cytochrome P450 epoxygenase (EPOX) pathways (Yang et al., 2011). Endocannabinoids provide substrate for the eicosanoid synthesizing cascade through both direct and indirect pathways. The indirect route is through the cleavage of either the AEA ethanolamide motif by fatty acid amide hydrolase (FAAH) or the 2-AG glycerol motif by monoacylglycerol lipase (MAGL), which produces AA that can enter one of the three branches (Yang et al., 2011). Alternatively, AEA can directly enter each of the pathways and produce a diverse range of metabolites with different pharmacological properties when compared to the endocannabinoid parent compound. Prior to this work, 2-AG was only shown to be a direct substrate of the COX and LOX pathways, although the 2-AG epoxide metabolites had been extracted from rat kidney, spleen and brain tissues (Chen et al., 2008). Recently it has been shown that endocannabinoids regulate human cardiovascular functions and are important for homeostasis (Pacher et al., 2009). Thus it is of interest to evaluate the metabolism of endocannabinoids by relevant heart enzymes. In this work, we reveal the nuances of the metabolism of 2-AG and AEA by the predominant EPOX enzyme in the heart, CYP2J2 epoxygenase. CYP2J2 is an extrahepatic cytochrome P450 that is highly expressed in the myocardium and surrounding aortic epithelium and has been shown to be an important regulator of cardiovascular function (Delozier et al., 2007; Alghasham et al., 2012; Panigrahy et al., 2012). CYP2J2 produces potent lipid epoxide mediators derived from AA known as epoxyeicosatrienoic acids (EETs), that are involved in pain, inflammation, kidney and cardiovascular disease (Imig and Hammock, 2009; Rouzer and Marnett, 2011). Additionally, the epoxygenases also produce hydroxyeicosatetraeonic acids (HETE) that are hydroxylated at the 19- or 20- position of AA.
Additionally, the activities of endocannabinoids are regulated through various activation and inactivation pathways. 2-AG is primarily inactivated through hydrolysis by MAGL (Rouzer and Marnett, 2011). However, inhibition of this enzyme does not completely block the 2-AG conversion to AA (Blankman et al., 2007). This indicates the presence of alternative pathways of attenuation. Here we demonstrate another potential pathway where 2-AG is converted to AA by CYP2J2 and other P450s.
In summary, we elucidate the nuances of binding and metabolism of AA and its derivatives, AEA and 2-AG, by CYP2J2 using LC-MS/MS, LC-MS, spectral titrations, small molecule ligand egress studies and molecular modeling. For all studies with recombinant protein we used nanodiscs (nanoscale lipid bilayers) to solubilize and stabilize membrane bound CYP2J2. Nanodiscs have been previously used to functionally stabilize membrane protein in solution and on surfaces (Nath et al., 2007; Bayburt and Sligar, 2010; Grinkova et al., 2010; Denisov and Sligar, 2011; Das et al., 2014; Orlando et al., 2014). Importantly, the use of these model membranes significantly reduced scattering and enabled spectroscopic characterization by increasing the solubility of the hydrophobic lipid substrates and membrane protein.
Reagents. NADPH and NADP were obtained from P212121.com. 1-palmitoyl-2-oleoyl-sn-glycero-3-
phosphocholine (POPC) and 1-hexadecanoyl-2-(9Z-octadecenoyl)-sn-glycero-3-phospho-L serine (POPS), 1-heptadecanoyl-2-arachidonoyl-sn-glycero-3-[phosphoinositol-4′,5′-bisphosphate] (PIP2) were purchased from Avanti Polar Lipids, Inc. AA, 2-AG, AEA, AEA-d4, MS-PPOH, 14,15-EET, 11-12- EET, 8,9-EET, 5,6-EET, 16,17-EpDPE, 2-(14,15-epoxyeicosatrienoyl glycerol), 14,15-EET ethanolamide was obtained from Cayman Chemical. Whole cow and porcine hearts were obtained fresh from the University of Illinois Meat Sciences Laboratory. Polyclonal CYP2J2 antibody (catalog No. ABIN1529400) and the HRP conjugated donkey anti-rabbit antibody (Catalog No. ABIN101948) were purchased from antibodies-online.com. Recombinant CYP2C8 supersomes were purchased from BD Biosciences Gentest. The anti-oxidant butylated hydroxytoluene (BHT) was obtained from Sigma. All other materials and reagents used were purchased from Sigma-Aldrich and Fisher Scientific.
Recombinant expression of CYP2J2 in E. coli. The recombinant CYP2J2 (construct D34G) was expressed and purified as published previously (McDougle et al., 2013; Zelasko et al., 2013). Briefly, DH5alpha cells containing the His-tagged and N-terminally truncated CYP2J2 plasmid and pTGro7 chaperonin plasmid were cultured in 30 mL of Luria Bertani (LB) media with chloroamphenicol (20 μg/mL) and ampicillin (100 μg/mL) at 37 ̊C and 250 rpm overnight. The resulting culture was used to inoculate 500 mL of Terrific Broth (TB) containing ampicillin (100 μg/mL) and chloroamphenicol (20 μg/mL). The culture was grown at 37 ̊C and 220 rpm until reaching an O.D. = 1.0, then -aminolevulinic acid (500 μl of 0.5 mM) was added and then grown for 2h at 26 ̊C and 160 rpm. 1 mM of Isopropyl -D- 1-thiogalactopyranoside (IPTG) and 2g of arabinose were added to each 500 mL culture for induction and subsequently grown for an additional 44 hours (Kagawa N and Cao, 2001). The cells were harvested via centrifugation (2800 g for 10 min) using a JA-10 rotor (Beckman Coulter, Brea, CA) at 4 ̊C. The cells were then sonicated in lysis buffer (DTT, and 0.2 mM phenylmethanesulfonylfluoride (PMSF), 5 mg of DNase and RNase) before ultracentrifugation at 140,000 g from 30 min Ti-45 rotor (Beckman) for membrane fraction isolation. Protein was extracted from the membrane fraction using 1.0% (w/v) cholate and stirred at 4 ̊C for four hours. The membrane fraction was removed by ultracentrifugation 140,000 g for 30 min with a Ti-45 rotor (Beckman). CYP2J2 was isolated from the supernatant by running the solution through a Ni-NTA column and eluting in 0.1% (w/v) cholate, 100 mM KPi, 200 mM imidazole and 20% glycerol with yields of ~150 nmol/L.
Incorporation of CYP2J2 into Nanodiscs. Purified CYP2J2 was incorporated into the membrane bilayers of Nanodiscs as previously described with the only modification being the addition of POPS (McDougle et al., 2013). POPS and POPC lipid stocks were combined in chloroform in a 20:80 molar ratio and dried down under a steady stream of N2. The lipid mixture was reconstituted with 200 mM cholate in phosphate buffer (pH 7.4) and added to membrane scaffold protein MSP1D1(-) in a 65:1 molar ratio and mixed at 4 ̊C for 1 hour. Purified CYP2J2 (100 mM KPi (pH 7.4), 20% (v/v) glycerol, and 0.1% cholate) was added to the solution in a CYP2J2:MSP molar ratio of 1:10 and mixed for several hours before detergent removal with Amberlite beads overnight. The CYP2J2-Nanodiscs were separated from empty Nanodiscs using a Ni-NTA column and eluted with 100 mM phosphate buffer containing 200 mM imidazole. Homogenous CYP2J2-ND populations were further purified using size-exclusion chromatography utilizing an Alliance 2695 analytical separation module (Waters, Milford, MA) coupled to a Waters 996 photodiode diode array detector (Waters) and a semi-preparative Superdex 10/200 column (GE Healthcare) column.
Immunoblotting of CYP2J2 located in cow and porcine heart microsomes. Heart microsomes were prepared as described above and used for CYP2J2 immunoblotting following a previously described protocol (Zeldin et al., 1997). In short, samples were boiled for 10 minutes 5x Laemmli buffer supplemented with 8 M urea and ran on a 12% SDS polyacrylamide gel. Proteins were transferred to the nitrocellulose membrane and blocked with 5% low-fat milk in Tris-buffered saline with tween 20 (TBST) for 1 hour before adding the primary polyclonal antibody raised against the 250-275 segment of human CYP2J2 (antibodies-online.com, catalog No. ABIN1529400). The membrane was washed three times with TBST and the HRP conjugated donkey anti-rabbit antibody (Catalog No. ABIN101948) was used for detection. Blots were visualized using a HRP development solution (Thermo Sci. Catalog No. 34095). and a ChemiDoc XRS+ system (Biorad Inc., Hercules, CA).
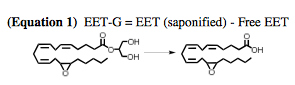
Equation 1. EET-G to EET conversion. Extracted EET-G regioisomers were converted to their corresponding EETs using methanolic KOH (0.4 N) and quantified using LC-MS/MS as described below.
LC-ESI-MS product analysis. AA, AEA and 2-AG regioisomers were resolved using a C18 column 2.1 x 150 mm, 3.5 μM (Waters, XTerra, P/N 186000408) and a Waters Alliance 2695 HPLC coupled to an electrospray ionization (ESI) source. For analysis of AA and AEA metabolites, the mobile phases consisted of mobile phase A (Acetonitrile/H2O/Formic Acid, 95:5:0.1) and mobile phase B (Acetonitrile/H2O/Formic Acid, 5:95:0.1) and were ran from 0-1 min, 60% A; 1-41 min, 60-20% A; 41- 42 min 0% A and then returned to initial conditions. The same solvent system was used in the analysis of 2-AG metabolites with a gradient of 0-1 min, 70% A; 1-51 min, 70-20% A; 51-52 min 0% A and then returned to initial conditions. For ESI, a Q-TOF Ultima time of flight mass spectrometer was used in positive ion mode for analysis of AEA, with a spray voltage of 4.5 V and capillary temperature of 200oC. Data were collected and processed using Mass Lynx software (version 4.1), initially scanning from 200 to 800 mass to charge ratio (m/z) and processed for the selected AEA-EET m/z of 364. The mass and elution time of the 14,15-EET-EA moiety was confirmed using the commercially available authentic standard. The detection of AA and 2-AG metabolites were detected with the same system in negative ion mode, with a cone voltage of 35 V and a 200oC desolvation temperature, scanning from 200 to 800 mass to charge ratio (m/z) and processed for the selected EET m/z of 319 and EET-G m/z of 393-394. The mass and elution times of the EET regio-isomers were confirmed with commercially available authentic standards. For 2-AG analysis, the mass and elution time of the commercially available 14,15-EET-G, EETs and AA lipids were confirmed with authentic standards purchased from Cayman Chemical.
Direct quantification of the 14,15-EET-G regioisomer were analyzed using the the 5500 QTRAP LC/MS/MS system with a linear gradient as follows: 0-2 min, 90% A; 8 min, 55% A; 13-25 min, 40% A; 30 min, 30% A; 35 min, 25% A; 40 min, 2% A; 45-47min, 15%A; 48-56min, 0%A; 57- 62min, 90%A. Mass spectra were acquired under positive (ion spray voltageat 5500 V) electrospray ionization (ESI). The source temperature was 450 oC. 14,15-EET-G (m/z 395.3- -> m/z 377.3) was measured in positive ESI with arachidonoly-1-thio-glycerol (m/z 395.3–> m/z 287.3) as an internal standard.
Quantification of CYP2J2-ND rate of 2-AG ester cleavage. The rate of 2-AG ester cleavage was quantified using a reversed-phase liquid chromatography (HPLC) system consisting of an Alliance 2695 analytical separation module (Waters, Milford MA) coupled to a Waters 996 photodiode array (PDA) and a C18 column, 1.3 Å, 2.1 mm × 50 mm, 3.5 μm pore size column (Waters, XTerra). The mobile system was composed of two solutions: solvent A (H2O/ACN/AcOH 95:5:0.1) and solvent B (H2O/ACN/AcOH 5:95:0.1). The linear gradient was as follows: 0-1 min, 60% A; 30 min, 20% A; 31 min, 0% A; return to initial conditions. Elution times of 12.6 min for 2-AG and 19.7 min for AA were verified with authentic standards. Quantification of free AA was calculated using AA absorbance at 204 nm. For kinetic analysis, samples containing CYP2J2-ND (50 pmol; 0.2 μM), CPR (150 pmol; 0.6 μM), 0.1% BHT in 0.1M phosphate buffer (pH 7.4) were incubated at 37oC for 5 minutes with 1, 5, 10, 20, 40 and 80 μM of 2-AG before initiation of reaction with 1 mM NADPH at 37 oC for 20 minutes. Controls lacking either NADPH or CYP2J2 were ran simultaneously with 80 μM of 2-AG.
Spectral titrations of CYP2J2-ND. Spectral binding studies were performed by titrating AA (both arachidonic acid and sodium arachidonate), AEA, 2-AG, MS-PPOH and ebastine against CYP2J2- Nanodiscs (8 μM) in 100 mM phosphate buffer (pH 7.4). Importantly, substrate stocks were prepared with DMSO (5 mM and 50 mM) after the addition of ethanol and acetonitrile were determined to cause type I binding. CYP2J2-ND were incrementally titrated with increasing concentrations of each putative substrate (either 5 mM or 50 mM stocks) at 22oC and allowed to equilibrate for 5 minutes before measuring the spectra. The total dilution of the original CYP2J2 concentration was 1.5%. Absorbance spectra were collected from 800-200 nm using a Cary Bio 300 UV-Vis spectrophotometer (Agilent Technologies, Santa Clara CA). Raw absorbance spectra were processed to the corresponding subtraction spectra using a standard MATLAB subroutine (Mathworks Inc., MI). The absolute absorbance difference of the subtraction spectra (peak and trough) were plotted against the corresponding substrate concentration in Origin Lab (Origin Lab Inc., Northhampton, MA) and fitted using a single binding isotherm (Eq. 2).
Where A is the absorbance difference at each difference spectra peak and trough, Amax is the amplitude corresponding to maximal spin shift, Ks is the spectral dissociation constant, S is the substrate concentration. None of the substrates investigated exhibited any homotropic cooperativity and hence the titration data was fitted to a single binding isotherm.
Cyanide binding and equilibrium constant (Ks) determination for CYP2J2-ND. The steady-state cyanide spectral equilibrium constants were determined by titrating cyanide concentrations (800 mM and 4 M stocks) against ~3 M of CYP2J2-ND in the absence and the presence of 40 μM of AA, AEA, 2-AG and MS-PPOH until saturation was reached (Das et al., 2014). The total addition of CYP2J2 concentration was 3% and did not affect Soret peak height. The raw data collected was converted into the difference spectra using a MATLAB subroutine (Mathworks Inc., MI). The A ( A 444-414nm) was plotted against the corresponding cyanide concentration and fitted to a single binding isotherm equation using Origin Pro 8.6 (San Clemente, CA) with equation 1 where A = A 444-414nm.
Transient cyanide binding kinetics to CYP2J2 active site measured using stopped-flow spectroscopy. The cyanide binding kinetics to the CYP2J2 active site in the absence and presence of varying concentrations of AA, AEA, 2-AG and MS-PPOH was determined using stopped-flow spectroscopy. Raw data was collected using an Applied Photophysics SX.18MV (Leatherhead, UK) spectrophotometer to monitor the rate of cyanide binding. A dual syringe system was prepared, with syringe I containing CYP2J2-ND in the absence or presence of varying concentrations (10, 20 and 40 μM) of substrate and syringe 2 containing 80 mM cyanide in the absence or presence of varying concentrations (10, 20 and 40 μM) of substrate. The relatively high cyanide concentration was selected based on steady state cyanide binding measurements and was necessary to ensure pseudo first-order binding kinetics (Denisov et al., 2007). The parameters for rapid mixing and data collection were as follows: 1.5 msec of dead time, external triggering mechanism, photodiode array detection and collection obtained on a logarithmic scale over 20 seconds. The raw data was converted to the difference spectra by subtracting each successive scan from the time = 0 scan using a MATLAB subroutine (Mathworks Inc., MI) that produced the typical 446 and 415 nm cyanide binding peaks. The difference of absorbance was plotted against time and analyzed with a double exponential equation using Origin Pro 8.6.
Where A1 and A2 are the amplitudes of the fast and slow phases of the reaction respectively and k1 and k2 are the rates of fast and slow phases of substrate binding to the protein, determined from fitting data obtained to equation 3.
Data Analysis. Data were analyzed and presented as means ± standard error. For all experiments, data were collected in triplicate (n = 3) or greater. Stopped flow data were analyzed for statistical significance using a student’s t-test where p < 0.05, p < 0.01 and p < 0.001 were denoted by *, **, and ***, respectively
Results
CYP2J2 mediated metabolism of AA and AEA determined using LC-ESI-MS. We first
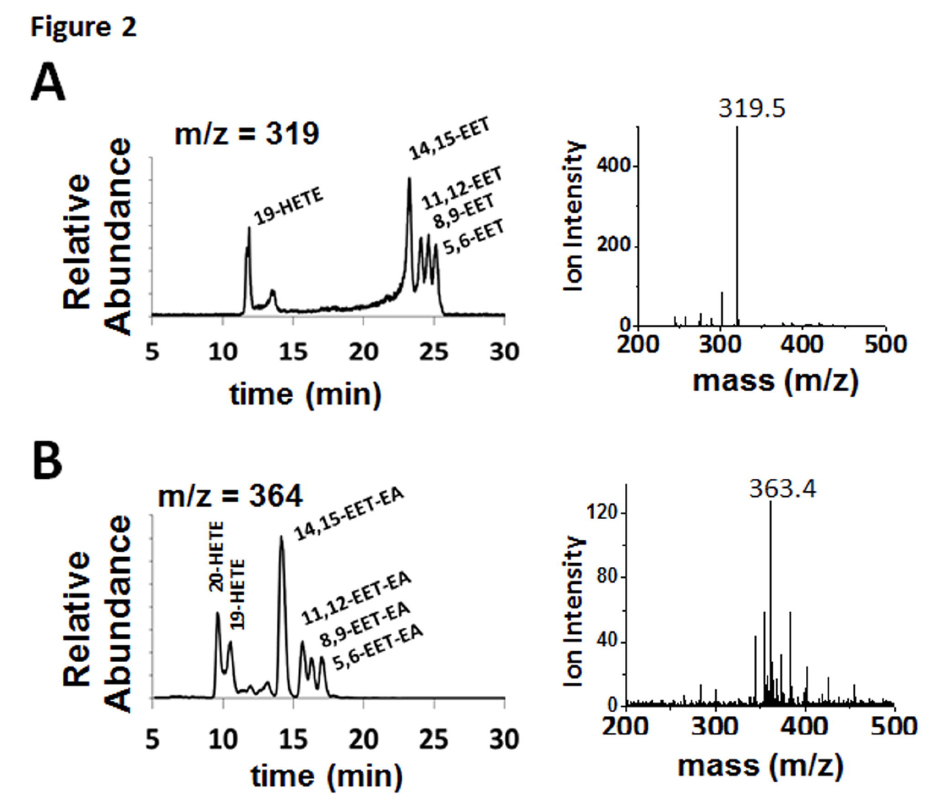
investigated the metabolism of AA and AEA by CYP2J2. CYP2J2 was recombinantly expressed in E.coli, purified and assembled into nanodiscs as described in the materials and methods. Due to increased functional stability of the CYP2J2-CPR-nanodisc system, all the studies reported here were done with the proteins incorporated into nanodiscs. To examine the metabolism of AA and AEA, a LC-ESI-MS method was developed to qualitatively assess the product formation. Importantly, the use of a slow linear gradient was necessary for separation of the regioisomers and structural identification by mass and elution time. Product analysis of CYP2J2-ND-CPR incubations with AA produced four regioisomers (m/z = 319.5) corresponding to the mass and elution times of 14,15-, 11,12-, 8,9- and 5,6-EET (Fig. 2A). The additional peaks (m/z 319), 19-HETE, was confirmed at earlier elution times (11 min). Similarly, analysis of CYP2J2 and AEA incubations produced the same olefin oxygenation pattern as AA, with a regioisomer corresponding to the elution times of 14,15-EET-EA as confirmed using the authentic standard (Fig. 2B). The identity of the 11,12-, 8,9-, and 5,6-EET-EA were extrapolated based on literature describing the elution profile and peak mass confirmation. Similar to AA, the presence of two additional metabolites corresponding to 19- and 20-HETE-EAs were observed. These results show that both AA and AEA are substrates of CYP2J2 and form four epoxide products similar to previous reports with other P450s (Snider et al., 2010).
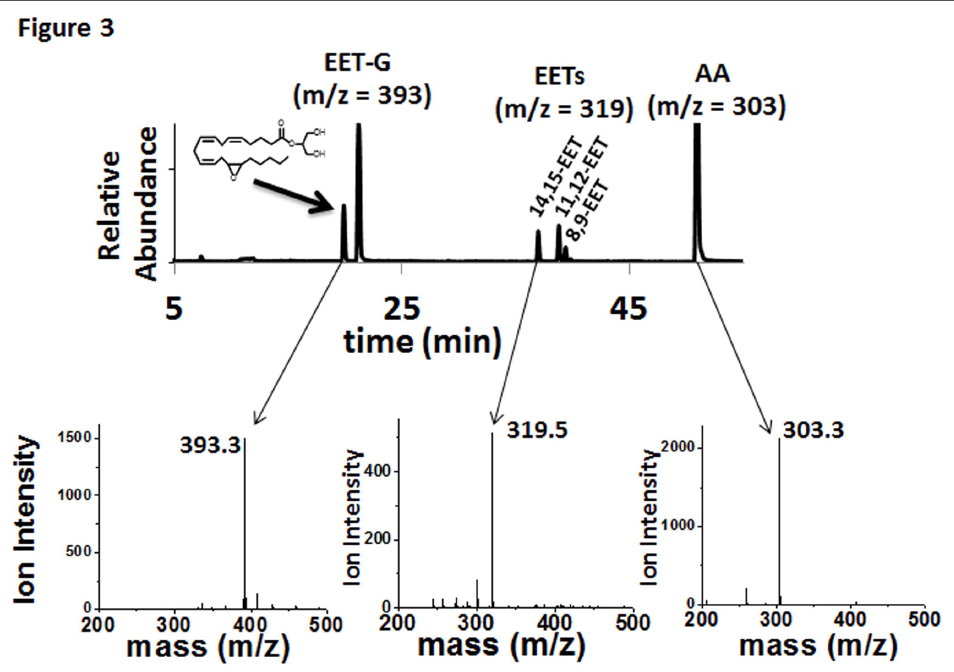
In contrast to AA and AEA, only two olefin sites of 2-AG were epoxidized to form 2-AG-EETs (m/z 393.3). Thus, the functional data suggests that the interaction of 2-AG within the CYP2J2 binding pocket is influenced by the presence of the bulky glycerol group of 2-AG (Fig. 1). Previous incubations with other P450s have failed to produce the EET-G regioisomers (Chen et al., 2008). Here we report that CYP2J2 is identified as an isoform of P450 that produces epoxide 2-AG metabolites. As a control we analyzed CYP2C8 (supersomes) with 2-AG following the same methodology and failed to observe any detectable EET-G formation (Supplemental Fig. 1). This suggests that CYP2J2 may be unique in the epoxidation of 2-AG as compared to other family 2 P450s.
Quantitative analysis of CYP2J2 mediated epoxidation of 2-AG and AEA using LC-ESI-MS/MS.The detection and quantification of fatty acids and their metabolites have been most commonly examined using radio flow HPLC due to the high sensitivity and ease of use (Wu et al., 1996). Alternatively, detection by mass spectrometry after derivatization, coupled with gas chromatography or liquid chromatography has also been widely used for EET analysis (Zhu et al., 1995). Here we successfully used HPLC coupled to a triple quadrupole detector utilizing one of the most sensitive commercially available ion trap (QTRAP 5500) which enabled a highly sensitive, accurate and reproducible method for detection of all the EET regioisomers in multiple reaction monitoring (MRM) mode. The limit of quantitation (LOQ) with a 10:1 signal to noise ratio for 5(6)-EET was 5.0 ng/mL, whereas 8,9-, 11,12-, 14,15-EET were calculated at 2.5 ng/mL. Prior to each run a six point standard curve was generated for each set of samples using authentic standards. Extraction efficiency was calculated for each of the EET regioisomers using the acidification and the three step ethyl acetate extraction. 14,15-, 11,12-, and 8,9-, and 5,6-EETs were extracted from the reaction mixture with a 95% or greater efficiency. Reaction linearity was demonstrated for each of the substrates at 15, 30 and 60 minutes with R2 values of 0.98 or greater. The advantages of a LC-MS/MS method are that it provides structural elucidation, quantification and efficiency with excellent sensitivity without the need of derivatization. This method should be widely applicable for complex biological samples with low levels of EETs. The identification of the metabolites of 2-AG and AEA were followed by quantification and measurement of the rate of formation using a LC- MS-MS method as described in the materials and method section (Fig. 4).
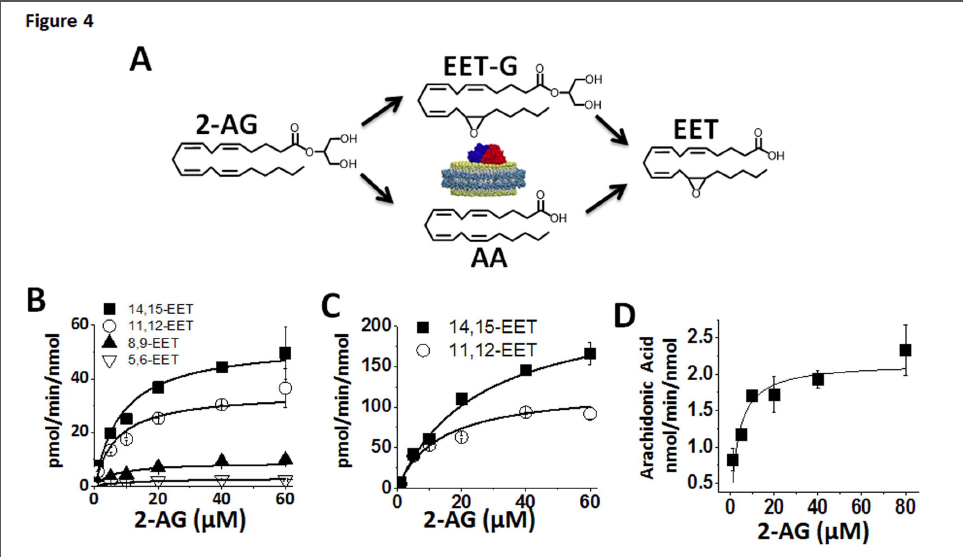
In a separate experiment, the rate of metabolism of arachidonic acid to form the four EET regio-isomers was measured in the presence of saturating concentrations of AA. Catalytic rates were calculated at 103 ± 4.6, 61.5 ± 5.6, 18.4 ± 1.7 and 8.9 ± 0.1 pmol/min/nmol of CYP2J2 for 14,15-, 11,12-, 8,9- and 5,6-EET, respectively.
Additionally, we examined the CYP2J2 mediated epoxidation of saturating amounts of AEA (60 μM) towards the production of 14,15-EET-EA which was calculated to be 391 ± 12 pmol/min/nmol of CYP2J2. Thus, the production of the 14,15-EET-EA appears to proceed at a significantly faster rate when compared to the production 14,15-EET from AA despite sharing a similar qualitative product profile and binding characteristics as discussed later.
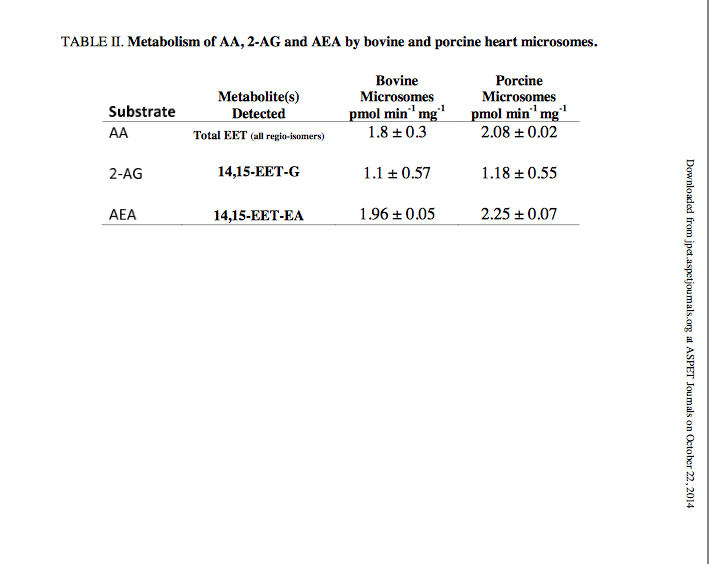
Bovine and porcine heart microsomes metabolism of AA and 2-AG. To examine whether the novel endocannabinoid epoxygenation reactions would occur within a complex environment in the presence of other proteins, we prepared heart microsomes from the tissue of bovine and porcine left ventricular myocardium. The rate of metabolism of AA, AEA and 2-AG are summarized in Table 2. We chose bovine and porcine species because they both contain CYP2J2 with high sequence homology to humans (Supplemental Figure 3). CYP2J2 immunoblotting of the bovine and porcine microsomes were performed using a polyclonal rabbit IgG antibody for human CYP2J2. The microsomal preparations cross-reacted with the CYP2J2 antibody demonstrating the presence of CYP2J2 in bovine and porcine hearts (Supplemental Figure 4). First, the functionality was assessed by measuring AA metabolism of bovine and porcine microsomes which produced 1.8 ± 0.3 and 2.08 ± 0.02 pmol min-1 mg-1 microsomal protein of EETs (all regio-isomers), respectively. Next we quantified 2-AG metabolism by directly measuring the production of the 14,15-EET-G regioisomer by bovine and porcine microsomes that was calculated at 1.17 ± 0.57 and 1.1 ± 0.55 pmol min-1 mg-1 microsomal protein, respectively. The 14,15-EET-EA isomer was produced with a higher turnover in both bovine and porcine microsomes with values of 1.96 ± 0.05 and 2.25 ± 0.07 pmol min-1 mg-1 microsomal protein, respectively.
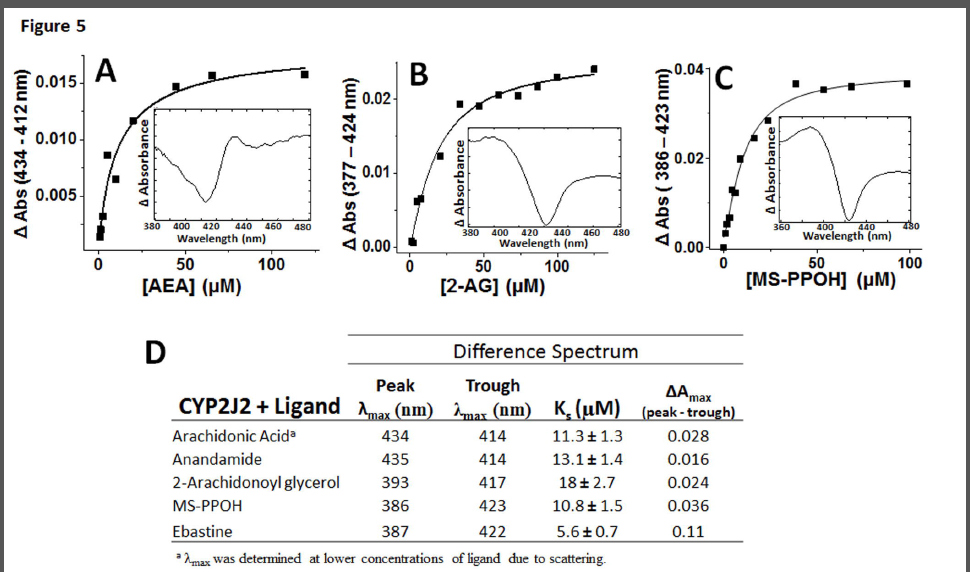
Spectral binding studies of CYP2J2 with AA, AEA and 2-AG. In an effort to understand the binding interactions of AA and its derivatives (AEA and 2-AG) with the active site of CYP2J2, we performed spectroscopic binding studies. First, the interactions of AA, AEA, 2-AG, ebastine and MS-PPOH with the CYP2J2-ND active site were investigated using UV-Vis spectral binding titrations (Fig. 5). As controls, the spectral binding properties of the potent epoxygenase inhibitor N-methylsulfonyl-6-(2- propargyloxyphenyl) hexanamide (MS-PPOH) (Falck et al., 1997) and ebastine were investigated and both induced type-I shifts with apparent spectral binding constants (Ks) of 10.8 ± 1.5 μM and 5.6 ± 0.7, respectively.
The fatty acids presented with smaller changes in spin-state and minor shifts in Soret band. Specifically, the Soret band at 417 nm red-shifted by 0.5 nm with a slight decrease in amplitude for both AA and AEA. The difference spectra revealed prominent troughs for both ligands at 414 nm and broad peaks at 434 and 435 nm for AA and AEA, respectively (Figure 5A). Both substrates were fitted to single binding isotherm with apparent Ks of 11.3 ± 1.3 μM for AA and 13.1 ± 1.4 μM for AEA (Figure 5D). The similarities between AA and AEA spectral shifts and binding equilibrium suggests that the presence of the ethanolamide (AEA) motif does not significantly alter substrate distances and positioning in relation to the heme when compared with AA. Conversely, 2-AG spectral titrations resulted in a blue-shift while slightly decreasing the Soret. The apparent Ks of binding for 2-AG was calculated at 18 ± 2.7 μM. Taken together, these data demonstrate that the modification of the carboxylic acid of the arachidonic acid with the glycerol moiety affects binding in CYP2J2’s large yet narrow binding cavity (Lafite et al., 2007). Note that the observed Soret shifts are not as prominent as xenobiotic P450 substrates, yet are consistent with the few published spectra of other fatty acids binding to membrane bound CYPs (Loughran et al., 2001). Moreover, the lack of significant Soret perturbations corresponds to the relatively low turnover rates of the AA metabolizing epoxygenases such as CYP2J2 (Westphal C et al., 2011). Additionally, these experiments were further validated using steady state cyanide binding experiments in the presence of AA, AEA and 2-AG to probe the access and binding of cyanide to the heme (Supplemental Figure 2).
Extrahepatic CYP2J2 epoxygenase metabolizes AA to form EETs that are essential for regulation of blood pressure and cardiovascular function (Spector, 2009). As previously mentioned, AA derived endocannabinoids play an important role in the cardiovascular system. Therefore we explored the metabolism of functionalized arachidonate containing lipids such as the endocannabionids with the cytochrome P450 most highly expressed in the human heart. The two most well characterized, arachidonic acid derived endocannabinoids are AEA and 2-AG whose dysregulation have been implicated in a wide range of pathophysiological states (Pacher et al., 2006; Kogan and Mechoulam, 2007; Pacher and Steffens, 2009). Herein, we demonstrate CYP2J2 mediated metabolism of AEA and 2-AG using recombinant human CYP2J2 and heart microsomes derived from bovine and porcine tissues. The results provided here show the endocannanbinoids 2-AG and AEA are both substrates of human CYP2J2 and that the predominant products, 14,15-EET-EA and 14,15-EET-G, are produced in heart microsomal systems of two different mammalian species, lending credibility to the proposed pathway in tissues.
The qualitative product analysis of CYP2J2-AEA incubations by LC-MS revealed four epoxide regio- isomers at the 5,6-, 8,9-, 11,12- and 14,15-olefin positions. The quantitative analysis of 14,15-EET-EA exhibited 4-fold more product when compared to the rate of formation of 14,15-EET regioisomer from AA. Previously, the oxygenation of AEA into a single hydroxy-product, 20-HETE ethanolamide, as well as four epoxide regio-isomers 5,6-, 8,9-, 11,12- and 14,15-EET-EA were demonstrated by several hepatic P450s including CYP2D6, CYP3A4 and CYP4F2 (Snider et al., 2010). However, this is the first report of the AEA metabolism by a CYP epoxygenase that is highly expressed in the myocardium and endocardium. Given the increasing reports of an endocannabinoid mediated regulation of blood pressure and the cardiovascular system, the role of the oxygenated AEA metabolites may provide an interesting avenue for future studies. For instance, AEA is a partial agonist of both CB1 and CB2 receptors whereas the 5,6-EET-EA metabolite selectively binds CB2 with much greater affinity (Snider et al., 2009). Additionally there is mounting evidence of CB2-cardioprotection versus CB1-cardiotoxicity and the ability to selectively target these pathways may provide a useful therapeutic target for the treatment of heart disease (Mukhopadhyay et al., 2008; Pacher and Steffens, 2009). Moreover, less is known about the physiological effects of the other EET-EA metabolites and whether they also exhibit differential receptor binding profiles and in vivo effects.
Due to the demonstrated beneficial functions of the endocannabinoids, there are several drugs in the market that target the enzymes that attenuate the in vivo levels of these substrates (Cravatt and Lichtman, 2003). Previous inhibition of enzymes that inactivate AEA and 2-AG have shown that the inhibition is incomplete (Blankman et al., 2007) indicating that there may be alternative pathways of attenuation of these endocannabinoids. We demonstrate here that 2-AG is converted to AA by CYP2J2 and CYP2C8 using an oxidative ester cleavage mechanism. Subsequent control experiments confirmed that the cleavage proceeded via an oxidative NADPH-dependent CYP2J2-CPR mechanism. To our knowledge, these results provide the first evidence of a P450 mediated endocannabinoid attenuation pathway for production of free arachidonic acid for subsequent metabolism in the classical eicosanoid pathways (COX, LOX and EPOX). Thus far, there have been no reports of an oxidative ester cleavage mechanism of endogenous 2-AG. However, other P450 isozymes have long been recognized as important sources of carbonyl products through non-hydrolytic ester cleavage reactions (Guengerich, 1987; Peng et al., 1995).
The binding interactions of arachidonic acid and its derivatives with the active site of CYP2J2 revealed relatively low spin state changes. Thus, the uses of the nanoscale lipid bilayers of nanodiscs were essential for the characterization of AA, AEA and 2-AG binding in spectroscopic studies with minimal spectral scattering. In general, there are very few examples of human CYP titrations in the literature, likely due to issues with solubility, scattering and low spin state changes. Interestingly, the few that have been published typically present with a similar spectra to what is presented in this work (Loughran et al., 2001). The ebastine, MS-PPOH and 2-AG Soret shifts present with classical type I binding modes (Fig. 5). The binding of AA and AEA was less clear and difficult to conclusively assign the classical type I and type II shifts due to the low signal to noise ratio. However, all the binding shifts were concentration dependent and reach saturation and are present with clear peaks/troughs lending credibility to the calculated binding constants. While the spin-state changes of the arachidonic acid and the derivatives are minor when compared with ebastine they do correspond to the relatively low catalytic turnover of these substrates. Importantly, the relatively slow turnover rates of CYP2J2 resemble the functions of the steroid synthesizing P450’s that regulate complex homeostatic processes rather than the very fast detoxification functions of liver CYPs.
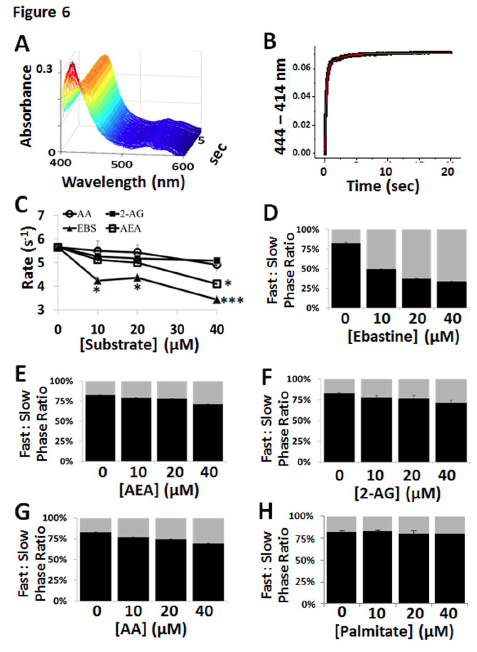
The results for the CYP2J2-ND substrate-free and substrate-bound stopped-flow cyanide binding experiments are summarized in Fig. 6 and Supplemental Table 1. For cyanide binding studies we employed ebastine and showed that the rates of the fast phase were significantly decreased with increasing ebastine concentrations similar to other P450-substrate systems (Denisov et al., 2007). Conversely, AA, AEA and 2-AG only showed modest inhibition of cyanide binding as shown in Fig. 6C and indicated that they either more easily egress from the active site or are bound as to not block cyanide binding. Similarly, the ratio of the fast- to slow-phase was significantly decreased in the presence of increasing concentrations of ebastine and only modestly decreased in the presence of increasing concentrations of AA, AEA and 2-AG (Fig. 6E – 6G). This effect was consistent and repeatable and not due to non-specific fatty acid binding as evidenced by the lack of change induced by palmitate (Fig. 6H).
In summary, we have demonstrated the ability of CYP2J2 to metabolize a diverse range of AA- containing substrates into a number of unique metabolites that have previously been shown to contain important physiological effects in vivo. Additionally, we provide important evidence that CYP2J2 can directly attenuate 2-AG levels through a NADPH-dependent oxidative cleavage mechanism, thereby producing free arachidonic acid for subsequent metabolism within the classical eicosanoid cascade. We further show that the formation of the metabolites of 2-AG and AEA are in agreement with the spectral binding studies and modeling.
We thank Dr. Ilia Denisov and Dr. Matthew Edin for helpful discussions. We thank Mr. William Arnold for editing the paper. We greatly appreciate the contributions of Dr. Zhong Li at the Metabolomics Lab of Roy J. Carver Biotechnology Center, University of Illinois at Urbana-Champaign. We want to thank Furong Sun and Dr. Kevin Tucker for their continued support at the School of Chemical Sciences mass spectrometry facility, University of Illinois at Urbana-Champaign. We thank Prof. Stephen Sligar for providing the gene encoding MSP1D1 and MSP1E3D1 and Prof. Robert Gennis for the use of stopped flow equipment, and Dr. Hanlin Ouyang for technical assistance. We thank Prof. Mary Schuler, Brendon Colón, and Eryk Radziszewski for training and assistance with the MOE modeling software. We thank Dr. Fan and Holly Pondenis for assistance with CYP2J2 immunoblotting. We want to thanks Dr. Bunick for providing us with the homogenizer.
This article has not been copyedited and formatted. The final version may differ from this version.
Authorship Contributions
Participated in research design: McDougle, Kambalyal, Meling, Das Conducted experiments: McDougle, Kambalyal
Performed data analysis: McDougle, Meling, Kambalyal, Das
Wrote or contributed to the writing of the manuscript: McDougle, Das
This article has not been copyedited and formatted. The final version may differ from this version.
Baudry J, Li W, Pan L, Berenbaum MR and Schuler MA (2003) Molecular docking of substrates and inhibitors in the catalytic site of CYP6B1, an insect cytochrome p450 monooxygenase. Protein Eng 16:577-587.
Baudry J, Rupasinghe S and Schuler MA (2006) Class-dependent sequence alignment strategy improves the structural and functional modeling of P450s. Protein Eng Des Sel 19:345- 353.
Bayburt TH and Sligar SG (2010) Membrane protein assembly into Nanodiscs. FEBS Lett 584:1721-1727.
Bidwai AK, Meyen C, Kilheeney H, Wroblewski D, Vitello LB and Erman JE (2013) Apolar distal pocket mutants of yeast cytochrome c peroxidase: Hydrogen peroxide reactivity and cyanide binding of the TriAla, TriVal, and TriLeu variants. Bba-Proteins Proteom 1834:137-148.
Blankman JL, Simon GM and Cravatt BF (2007) A comprehensive profile of brain enzymes that hydrolyze the endocannabinoid 2-arachidonoylglycerol. Chem Biol 14:1347-1356.
Capdevila JH, Dishman E, Karara A and Falck JR (1991) Cytochrome P450 arachidonic acid epoxygenase: stereochemical characterization of epoxyeicosatrienoic acids. Methods Enzymol 206:441-453.
Cravatt BF and Lichtman AH (2003) Fatty acid amide hydrolase: an emerging therapeutic target in the endocannabinoid system. Curr Opin Chem Biol 7:469-475.
Das A, Varma SS, Mularczyk C and Meling DD (2014) Functional investigations of thromboxane synthase (CYP5A1) in lipid bilayers of nanodiscs. Chembiochem 15:892- 899.
Delozier TC, Kissling GE, Coulter SJ, Dai D, Foley JF, Bradbury JA, Murphy E, Steenbergen C, Zeldin DC and Goldstein JA (2007) Detection of human CYP2C8, CYP2C9, and CYP2J2 in cardiovascular tissues. Drug Metab Dispos 35:682-688.
Denisov IG, Grinkova YV, McLean MA and Sligar SG (2007) The one-electron autoxidation of human cytochrome P450 3A4. The Journal of Biological Chemistry 282:26865-26873.
Denisov IG and Sligar SG (2011) Cytochromes P450 in nanodiscs. Biochim Biophys Acta 1814:223-229.
Falck JR, Belosludtsev YY, Reddy KK, Reddy KM, Shortt MF, Chauhan K, Capdevila JH and Wei SZ (1997) Eicosanoid biosynthesis: Differential inhibition of cytochrome P450 epoxygenase and omega-hydroxylase. Bioorg Med Chem Lett 7:3053-3056.
Grinkova YV, Denisov IG and Sligar SG (2010) Functional reconstitution of monomeric CYP3A4 with multiple cytochrome P450 reductase molecules in Nanodiscs. Biochem Biophys Res Commun 398:194-198.
Guengerich FP (1987) Oxidative cleavage of carboxylic esters by cytochrome P-450. J Biol Chem 262:8459-8462.
Imig JD and Hammock BD (2009) Soluble epoxide hydrolase as a therapeutic target for cardiovascular diseases. Nat Rev Drug Discov 8:794-805.
Kogan NM and Mechoulam R (2007) Cannabinoids in health and disease. Dialogues Clin Neurosci 9:413-430.
Lafite P, Andre F, Zeldin DC, Dansette PM and Mansuy D (2007) Unusual regioselectivity and active site topology of human cytochrome P450 2J2. Biochemistry 46:10237-10247.
Loughran PA, Roman LJ, Miller RT and Masters BS (2001) The kinetic and spectral characterization of the E. coli-expressed mammalian CYP4A7: cytochrome b5 effects vary with substrate. Arch Biochem Biophys 385:311-321.
McDougle DR, Palaria A, Magnetta E, Meling DD and Das A (2013) Functional studies of N- terminally modified CYP2J2 epoxygenase in model lipid bilayers. Protein Sci 22:964- 979.
Mukhopadhyay P, Mohanraj R, Batkai S and Pacher P (2008) CB1 cannabinoid receptor inhibition: promising approach for heart failure? Congest Heart Fail 14:330-334.
Nath A, Grinkova YV, Sligar SG and Atkins WM (2007) Ligand binding to cytochrome P450 3A4 in phospholipid bilayer nanodiscs: the effect of model membranes. J Biol Chem 282:28309-28320.
Orlando BJ, McDougle DR, Lucido MJ, Eng ET, Graham LA, Schneider C, Stokes DL, Das A and Malkowski MG (2014) Cyclooxygenase-2 catalysis and inhibition in lipid bilayer nanodiscs. Arch Biochem Biophys 546:33-40.
Pacher P and Steffens S (2009) The emerging role of the endocannabinoid system in cardiovascular disease. Semin Immunopathol 31:63-77.
Panigrahy D, Edin ML, Lee CR, Huang S, Bielenberg DR, Butterfield CE, Barnes CM, Mammoto A, Mammoto T, Luria A, Benny O, Chaponis DM, Dudley AC, Greene ER, Vergilio JA, Pietramaggiori G, Scherer-Pietramaggiori SS, Short SM, Seth M, Lih FB, Tomer KB, Yang J, Schwendener RA, Hammock BD, Falck JR, Manthati VL, Ingber DE, Kaipainen A, D’Amore PA, Kieran MW and Zeldin DC (2012) Epoxyeicosanoids stimulate multiorgan metastasis and tumor dormancy escape in mice. J Clin Invest 122:178-191.
Peng HM, Raner GM, Vaz AD and Coon MJ (1995) Oxidative cleavage of esters and amides to carbonyl products by cytochrome P450. Arch Biochem Biophys 318:333-339.
Pretorius PJ, Pohl WG, Smithen CS and Inesi G (1969) Structural and functional characterization of dog heart microsomes. Circ Res 25:487-499.
Rouzer CA and Marnett LJ (2011) Endocannabinoid Oxygenation by Cyclooxygenases, Lipoxygenases, and Cytochromes P450: Cross-Talk between the Eicosanoid and Endocannabinoid Signaling Pathways. Chem Rev 111:5899-5921.
Snider NT, Kornilov AM, Kent UM and Hollenberg PF (2007) Anandamide metabolism by human liver and kidney microsomal cytochrome p450 enzymes to form hydroxyeicosatetraenoic and epoxyeicosatrienoic acid ethanolamides. J Pharmacol Exp Ther 321:590-597.
Snider NT, Sikora MJ, Sridar C, Feuerstein TJ, Rae JM and Hollenberg PF (2008) The Endocannabinoid Anandamide Is a Substrate for the Human Polymorphic Cytochrome P450 2D6. Journal of Pharmacology and Experimental Therapeutics 327:538-545.
Snider NT, Walker VJ and Hollenberg PF (2010) Oxidation of the endogenous cannabinoid arachidonoyl ethanolamide by the cytochrome P450 monooxygenases: physiological and pharmacological implications. Pharmacol Rev 62:136-154.
Spector AA (2009) Arachidonic acid cytochrome P450 epoxygenase pathway. J Lipid Res 50 Suppl:S52-56.
Sridar C, Snider NT and Hollenberg PF (2011) Anandamide Oxidation by Wild-Type and Polymorphically Expressed CYP2B6 and CYP2D6. Drug Metabolism and Disposition 39:782-788.
Stark K, Dostalek M and Guengerich FP (2008) Expression and purification of orphan cytochrome P450 4X1 and oxidation of anandamide. Febs J 275:3706-3717.
Westphal C, Konkel A and WH. S (2011) CYP-eicosanoids–a new link between omega-3 fatty acids and cardiac disease? Prostaglandins Other Lipid Mediat 96:99-108.
Wu S, Moomaw CR, Tomer KB, Falck JR and Zeldin DC (1996) Molecular cloning and expression of CYP2J2, a human cytochrome P450 arachidonic acid epoxygenase highly expressed in heart. J Biol Chem 271:3460-3468.
Yang J, Dong H and Hammock BD (2011) Profiling the regulatory lipids: another systemic way to unveil the biological mystery. Curr Opin Lipidol 22:197-203.
Zeldin DC, Foley J, Goldsworthy SM, Cook ME, Boyle JE, Ma J, Moomaw CR, Tomer KB, Steenbergen C and Wu S (1997) CYP2J subfamily cytochrome P450s in the gastrointestinal tract: expression, localization, and potential functional significance. Mol Pharmacol 51:931-943.
Zhu Y, Schieber EB, McGiff JC and Balazy M (1995) Identification of arachidonate P-450 metabolites in human platelet phospholipids. Hypertension 25:854-859.
This work was funded in part through the American Heart Predoctoral Fellowship [14PRE20130015] (D.R.M). The Roy J. Carver Biotechnology Center’s 5500 QTrap MS was funded by NIH National Center for Research Resources [S10RR024516]. The School of Chemical Sciences Q-TOF Ultima mass spectrometer was purchased in part with a grant from the National Science Foundation, Division of Biological Infrastructure [DBI-0100085].
FIGURE 1. Chemical structures of substrates that bind to CYP2J2-nanodiscs. Endogenous CYP2J2 ligands include (A) arachidonic acid, (B) anandamide and (C) 2-arachidonoyl glycerol. (D) The xenobiotic, ebastine, is a cardiotoxic 2J2 substrate. (E) MS-PPOH (N-(methylsulfonyl)-2-(2- propynyloxy)-benzenehexanamide) is a non-specific CYP inhibitor. (F) Schematic of CYP2J2 and CPR incorporated into the membrane bilayers of nanodiscs. The membrane scaffold protein (MSP) is represented in cyan surrounding a bilayer of phospholipids colored white with gold phosphate head groups. CYP2J2 is red and its obligate redox partner cytochrome P450 reductase is colored blue.
FIGURE 2. Metabolism of AA and AEA by human CYP2J2-ND-CPR identified qualitatively using LC- ESI-MS. CYP2J2-ND incubations with substrates were analyzed as described in the materials and methods. The different regio-isomers of (A) AA (m/z = 319.5 of 14,15-EET at 22.5 min) and (B) AEA (m/z = 363.4 of 14,15-EET-EA at 14 min) produced six different products including four epoxide regio- isomers at the 5,6-, 8,9-, 11,12- and 14,15-olefin positions and two HETEs.
FIGURE 3. Metabolism of 2-AG by CYP2J2-ND-CPR identified qualitatively using LC-ESI-MS. Metabolism of 2-AG by incubations with CYP2J2-ND-CPR revealed the following metabolic profile as represented in the chromatogram that consists of an overlay of two EET-G regio-isomers, 14,15-EET-G and 11,12-EET-G (m/z 393), three detectable EET regio-isomers, 14,15-EET, 11,12-EET and 8,9-EET (m/z = 319) and arachidonic acid (m/z = 303).
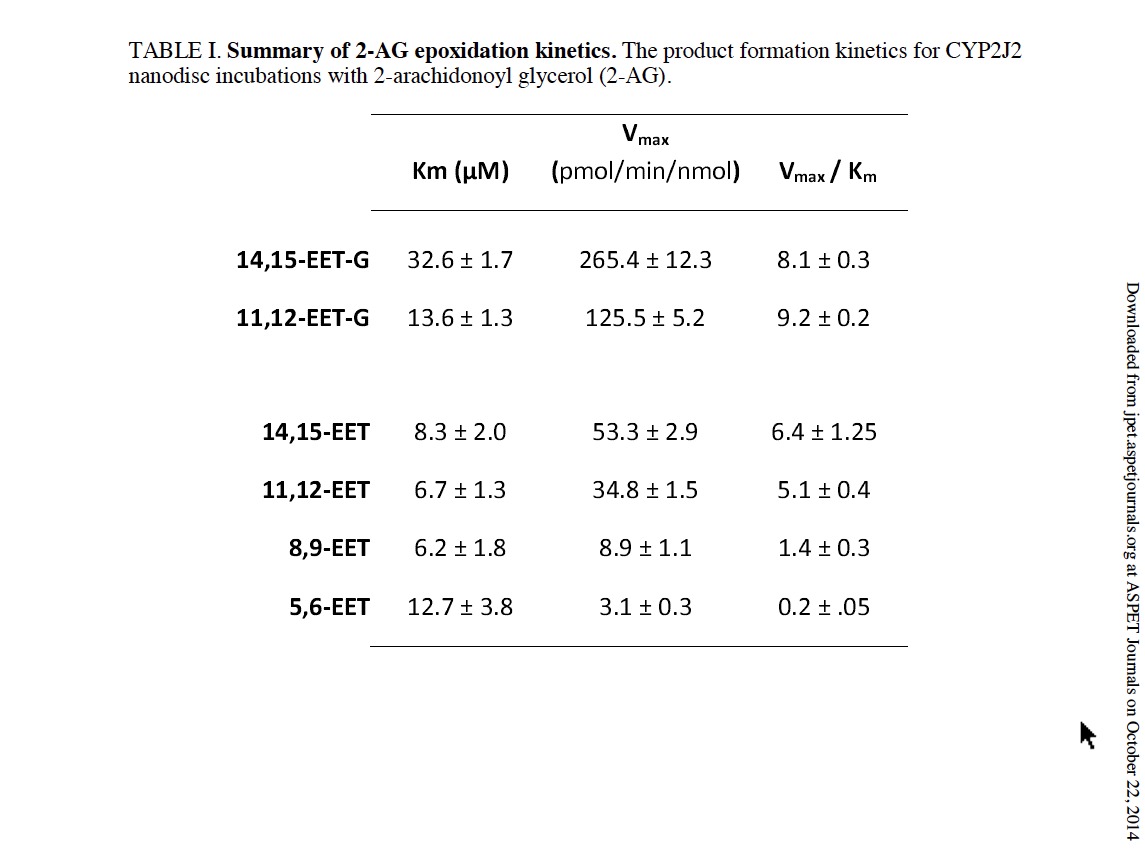
FIGURE 4. Kinetics of CYP2J2 mediated metabolism of 2-AG. (A) Schematic of the proposed routes of 2-AG metabolism by CYP2J2 that produces AA, EET-G and EET. The kinetic rates of the three products were quantified as described in the materials and methods. (B) Kinetics of the formation of the four regio- isomers, 14,15-, 11,12-, 8,9- and 5,6-EET were detected by LC-MS-MS. These correspond to the free EETs in solution that were generated either from epoxidation of AA or oxidative ester cleavage of EET-G. (C) Kinetics of the formation of the two EET-G regioisomers, 14,15-EET-G and 11,12-EET-G analyzed as described in the materials and methods section. (D) The kinetics of CYP2J2-ND mediated 2- AG ester cleavage and arachidonic acid production were determined by monitoring AA formation. The data were fitted to Michaelis-Menten kinetics in Origin Pro 8.6 for calculation of Vmax and Km. The kinetic rates of the epoxidation reactions and side reactions are summarized in Table 1.
FIGURE 6. Stopped-flow cyanide binding spectroscopy with CYP2J2-ND and AA, 2-AG, AEA and ebastine. (A) Stopped-flow spectroscopy was used to monitor kinetics of cyanide binding to CYP2J2-ND by recording the formation of the cyanide-heme complex at 444 nm as a function of time in the presence of saturating [CN-]. (B) The difference spectra ( Abs 444-414 nm) was plotted against time and fitted to a double exponential equation for determination of the rate of the (C) fast-phase for each substrate concentration tested and determination of statistical significance relative to the substrate free condition when p < 0.05, p < 0.01 and p < 0.001 which are denoted by *, **, and ***, respectively. The ratio of the amplitudes of the fast-phase (black) to slow-phase (gray) were dramatically altered in the presence of (D) ebastine whereas the presence of the polyunsaturated fatty acids such as (E) AEA (F) 2-AG and (G) AA were modestly changed. (H) The saturated fatty acid palmitate did not alter cyanide binding characteristics.
Images to follow: