
Optimization and characterization of triazole urea inhibitors for abhydrolase domain containing protein 6 (ABHD6)
Ku-Lung Hsu, Katsunori Tsuboi, Anna E Speers, Steven J Brown, Timothy Spicer, Virneliz Fernandez-Vega, Jill Ferguson, Benjamin F Cravatt, Peter Hodder, and Hugh Rosen.
Author Information
Received: April 12, 2012; Last Update: March 14, 2013.
Assigned Assay Grant #: 1 R01 DA025285
Screening Center Name & PI: The Scripps Research Institute Molecular Screening Center (SRIMSC), H Rosen
Chemistry Center Name & PI: SRIMSC, H Rosen
Assay Submitter & Institution: BF Cravatt, TSRI, La Jolla
PubChem Summary Bioassay Identifier (AID): 504420
Probe Structure & Characteristics
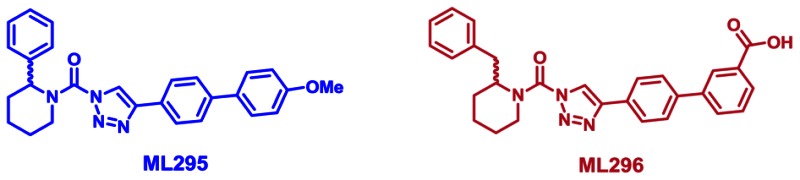
| CID/ML# | Target Name | Target IC50* (nM) [SID, AID] | Anti-target Name(s) | Anti-target IC50* (nM) [SID, AID] | Fold Selective† | Secondary Assay(s) Name: [SID, AID] |
|---|---|---|---|---|---|---|
| CID 53364533/ML295 | ABHD6 | 38 [SID 125269138,AID 602320] | DAGL-β | >3333 [SID 125269138,AID 602322] | >85 | Inhibition Assay: [SID 125269138and SID 125269096, AID 602322and AID 602319] Selectivity Assay SHs: [SID 125269138, AID 602311 and AID 602355; SID 125269096, AID 602321] Selectivity Assay DAGL-β: [SID 125269138, AID 602299; SID 125269096, AID 602300] Selectivity Assay ABHD11: [SID 125269138 and SID 125269096, AID 602312] Selectivity Assay ABPP-SILAC:[SID 125269138, AID 602341] Selectivity Assay ABPP-MudPIT: [SID 125269138, AID 602351] In situ Assay: [SID 125269138(IC50 = 1.3 nM) and SID 125269096(IC50 = 0.3 nM), AID 602335] In vivo Assays: [SID 125269138,AID 602343, AID 624077, and AID 624041; SID 125269096, AID 602343, AID 624077, and AID 602349] Cytotox assay: [SID 125269138 andSID 125269096, AID 602337] |
| 20+ SH targets | > 2000**[SID 125269138,AID 602355] | >50 | ||||
| CID 53364510/ML296 | ABHD6 | 0.8 [SID 125269096,AID 602320] | DAGL-β | >100 [SID 125269096,AID 602322] | >125 | |
| 20+ SH targets | > 1000**[SID 125269096,AID 602321] | >1250 |
- *
- As assessed by gel-based competitive ABPP
- **
- IC50 of the anti-target is defined as greater than the test compound concentration at which less than or equal to 50% inhibition of the anti-target is observed, which is reported in AID 602355 for SID 125269138 and AID 602321 for SID 125269096. For SID 125269138, no anti-targets were observed for all serine hydrolases (SHs) assayed at 2000 nM concentration, so the IC50 is reported as >2000 nM; for SID 125269096, no anti-target SHs were observed at 1000 nM concentration, so the IC50 is reported as >1000 nM.
- †
- Fold-selectivity was calculated as: >IC50 for anti-target/IC50 for ABHD6
1 Recommendations for Scientific Use of the Probe
Endocannabinoids (i.e., endogenous cannabinoids; ECs), represent a unique group of lipids that function as chemical messengers in the nervous system. To date, the two principle ECs identified in mammals are N-arachidonoyl-ethanolamine (anandamide) and 2-arachidonoyl-glycerol (2-AG). They have been implicated in various physiological and pathological functions including appetite, pain, sensation, memory, and addiction [1]. Upon activation of postsynaptic neurons, ECs are produced from membrane-derived lipid precursors, traverse the synaptic cleft, and activate specific G-protein-coupled cannabinoid receptors present on presynaptic termini. The activated cannabinoid receptors initiate a series of signal transduction cascades that ultimately leads to the suppression of neurotransmitter release. Depending on the type of neurotransmitter released (excitatory vs. inhibitory), this feedback mechanism can attenuate or prolong neurotransmission, and is hypothesized to modulate both short- and long-term synaptic plasticity [2].
Unlike traditional neurotransmitters, which are stored in vesicles, ECs are synthesized and released on demand, and then rapidly degraded to terminate signaling. Thus, the metabolic pathways that govern EC turnover are critical in determining the magnitude and duration of neuronal signaling events [3]. The development of both genetic knockouts and small molecule inhibitors has facilitated our understanding of EC degradation at the molecular level, and allowed the principle anandamide- and 2-AG-degrading enzymes (fatty acid amide hydrolase, FAAH [4] and monoacylglycerol lipase [MAGL], respectively [5]) to be characterized in vivo. A recent investigation [5], however, revealed two additional key 2-AG-degrading enzymes in the brain, the formerly uncharacterized serine hydrolases (SHs) abhydrolase domain containing proteins 6 and 12 (ABHD6 and ABHD12). Interestingly, MAGL, ABHD6, and ABHD12 display distinct subcellular localizations: both ABHD6 and ABHD12 are predicted integral membrane enzymes, whereas MAGL is peripherally membrane associated. And while ABHD12 is glycosylated, corresponding to a luminal or extracellular orientation, ABHD6 shows no evidence of glycosylation, thus indicating a cytoplasmic exposure [5]. This disparate localization suggests that the three enzymes govern distinct pools of 2-AG in the CNS. Consistent with this premise, recent studies using first-generation inhibitors of ABHD6 have provided evidence that ABHD6 and MAGL both play important roles in controlling 2-AG metabolism in primary neurons [6]. However, elucidating respective roles for these enzymes in the brain and other tissues requires selective pharmacological tools to perturb their function in vivo.
Our probe ML294 is highly potent against DAGL-β (IC50s of 56 nM in vitro and 12 nM in situ) and is also active in vivo, showing good blood-brain barrier penetration and oral bioavailability. ML294 does exhibit potent, subnanomolar inhibition of one other SH, ABHD6 (IC50s of ~1 nM in vitro and 0.48 nM in situ). Otherwise,ML294 exhibited high selectivity against all other SHs assessed by gel-based and LC-MS/MS-based competitive ABPP (see ML294 Probe Report). Therefore, we also developed an ABHD6-selective triazole urea probe, ML295. One of the more compelling reasons for declaring ML295 as the anti-probe for ML294 was its similar potency for ABHD6 (38 nM in vitro, 1.3 nM in situ) vs. that of ML294 for its target DAGL-β (56 nMin vitro, 12 nM in situ; see ML294 Probe Report). Selectivity for ML295 was also confirmed by in-depth LC-MS/MS profiling of 40+ other SHs both in situ (by ABPP-SILAC) and in vivo (by ABPP-MudPIT). Further SAR manipulation also produced probe ML296, a compound good potency (IC50s of 0.8 nM in vitro and 0.3 nM in situ) and good selectivity (>125-fold vs. DAGL-β, >1250-fold vs. mouse brain membrane SHs), as well as high solubility (84.5 μM). The key distinguishing feature of ML296 is that, while ML295 is blood-brain barrier penetrant in mice, ML296 has a peripherally-restricted in vivo biodistribution, providing a key pharmacological tool for selective inactivation of ABHD6 in peripheral tissues, like the liver, where ABHD6 is also expressed. These successful probe development efforts further confirm the privileged nature of the triazole urea scaffold for potent and selective inhibition of SH targets in living systems (see also refs. 7–9). ML295 and ML296 are recommended for use in primary research studies aimed at elucidating the patho/physiological roles of ABHD6 and its contribution to 2-AG-mediated signaling, as well as other lipid metabolic pathways.
2 Materials and Methods
All reagents for chemical synthesis were obtained from ThermoFisher or SigmaAldrich. All other protocols are summarized in the following sections.
2.1 Assays
Probe Characterization Assays
Solubility in PBS: The solubility of compounds are tested in triplicate in phosphate buffered saline (PBS), pH 7.4. per well, 198 μl PBS is added to a Millipore Solvinert Hydrophilic PTFE 96 well filter plate: pore size: 0.45um (MSRLN0450). Test compounds are introduced from 10 mM DMSO stock solutions (2 μl). The final concentration of DMSO was 1 percent. Samples are allowed to incubate at 22ºC for 18 hours. In the morning the plate is centrifuged where the soluble portion passes through the filter and is collected in a capture plate. Clotrimazole is included as a control to assure the assay is working properly. The samples are analyzed by HPLC. Peak area is compared to a standard of known concentration. In cases when the concentration was too low for UV analysis or when the compound did not possess a good chromophore, LC-MS-MS analysis is used.
Solubility in Media: The solubility of compounds are tested in triplicate in complete media (DMEM + 10% FBS). Per well, 198 μl PBS is added to a Millipore Solvinert Hydrophilic PTFE 96 well filter plate: pore size: 0.45 um (MSRLN0450). Test compounds are introduced from 10 mM DMSO stock solutions (2 μl). The final concentration of DMSO was 1 percent. Samples are allowed to incubate at 22ºC for 18 hours. In the morning the plate is centrifuged where the soluble portion passes through the filter and is collected in a capture plate. The samples are analyzed by HPLC (Agilent 1100 with diode-array detector). Peak area is compared to a standard of known concentration. In cases when the concentration was too low for UV analysis or when the compound did not possess a good chromophore, LC-MS-MS analysis is used.
Stability in PBS: Demonstration of stability in PBS was conducted by addition of 10 μM compound from a DMSO stock to PBS in HPLC autosampler vials. Samples are held in the HPLC autosampler at ambient temperature. At approximately 0, 1, 2, 4, 8, 24, and 48 hours the samples are injected on the HPLC. Peak area and retention time are compared between injections. Data is log transformed and represented as half-life. DMSO is added as a co-solvent as needed for solubility.
Determination of Glutathione Reactivity: Compound (10 μM) is incubated at 37°C for 6 hours in the presence of 50 μM freshly prepared reduced glutathione. At 0 and 6 hours the samples are injected on the HPLC. Peak area and retention time are compared between injections. Samples are evaluated for a glutathione dependent decrease in compound concentration. DMSO is added as a co-solvent as needed for solubility.
Primary Assays
Primary uHTS assay to identify DAGL-β inhibitors (AID 504411)
Assay Overview: The purpose of this assay is to identify compounds that inhibit the activity of human diacylglycerol lipase-beta (DAGL-β). In this assay, compounds are preincubated with membranes derived from mouse DAGL-β-transfected HEK293T cells (Open Biosystems Accession BC016105), followed by incubation with the fluorogenic lipase substrate EnzChek. Fluorescence is determined at a specific time point. As designed, compounds that act as DAGL-β inhibitors will slow the rate of substrate hydrolysis, resulting in a decrease in well fluorescence. Compounds are tested in singlicate at a final nominal concentration of 5.17 μM.
Protocol Summary: Prior to the start of the assay, DAGL-β membrane lysate was sonicated three times for 5 seconds, 1 minute between each pulse using a microtip. Then, 4.0 μL of Assay Buffer (50 mM HEPES pH7.2, 100 mM NaCl, 5 mM CaCl2, 0.1% Triton X-100, 10% DMSO and 0.5 mM DTT) containing 0.375 mg/mL of DAGL-β membrane lysate were dispensed into 1536 microtiter plates. Next, 26 nL of test compound in DMSO or DMSO alone (0.52% final concentration) were added to the appropriate wells and incubated for 60 minutes at 25°C. The assay was started by dispensing 1.0 μL of 5 μM EnzChek lipase substrate in Assay Buffer to all wells. Plates were centrifuged and incubated for 60 minutes at 25°C. Fluorescence was read on a Viewlux microplate reader (PerkinElmer, Turku, Finland) using a FITC filter set (excitation = 480 nm, emission = 540 nm) and a FITC dichroic mirror for 1 second. Assay Cutoff: Compounds that inhibited DAGL-β ≥34.1% were considered active.
Confirmation uHTS assay to identify DAGL-β inhibitors (AID 504445)
Assay Overview: The purpose of this assay is to confirm activity of compounds identified as active in the primary uHTS pPAFAH screen (AID 504411). In this assay, the fluorogenic lipase substrate EnzChek is used to assess inhibition of DAGL-β in a complex membrane preparation as described above (AID 504411). Compounds were tested in singlicate at a final nominal concentration of 5.17 μM.
Protocol Summary: The assay was performed as described above (AID 504411), except that compounds were tested in triplicate. Assay Cutoff: Compounds that inhibited DAGL-β ≥34.1% were considered active.
Secondary Assays
Gel-based competitive ABPP inhibition of overexpressed DAGL-β in vitro: triazole urea library (AID 602303)
Assay Overview: The purpose of this assay is to determine whether test compounds belonging to the triazole urea scaffold can inhibit DAGL-β in a complex proteome using a gel-based competitive activity-based proteomic profiling (ABPP) assay. In this assay, the target enzyme DAGL-β is incubated with test compound followed by reaction with a fluorescently-tagged serine-hydrolase specific activity-based probe, fluorophosphonate-rhodamine (FP-Rh, Thermo #88318). For this assay and all other gel-based ABPP assays described below, the reaction products are separated by SDS-PAGE and visualized in-gel using a flatbed fluorescence scanner. The percentage activity remaining is determined by measuring the integrated optical density (IOD) of the bands. As designed, test compounds that act as DAGL-β inhibitors will prevent enzyme-probe interactions, thereby decreasing the proportion of bound fluorescent probe, giving lower fluorescence intensity in the band in the gel. See also refs. [8, 9].
Protocol Summary: Membrane proteome of transiently transfected 293T Hek cells overexpressing mouse DAGL-β (25 μL of 0.3 mg/mL) in Dulbecco’s PBS (DPBS) was treated with test compound (0.5 μL of a 50x stock in DMSO; 500 nM final concentration) or DMSO (0.5 μL) for 30 minutes at 37°C. The activity-based probe FP-Rh (0.5 μL of a 50x stock in DMSO; 5 μM final concentration) was added, and the reaction was incubated for 30 minutes at 37°C, quenched with an equal volume of 2x SDS-PAGE loading buffer (reducing), separated by SDS-PAGE, and visualized by in-gel fluorescent scanning. The percentage of DAGL-β activity remaining was determined by measuring the integrated optical density of the individual protein bands relative to the DMSO-only (no compound) control. Assay Cutoff: Compounds with greater than or equal to 50% inhibition were considered active.
Gel-based competitive ABPP inhibition of ABHD6 in vitro (AID 602319)
Assay Overview: The purpose of this assay is to determine whether test compounds can inhibit endogenous ABHD6 using a gel-based ABPP assay. In this assay, a complex proteome natively expressing ABHD6 is incubated with test compound followed by reaction with a fluorescently-labeled activity-based probe, HT-01 [9], which selectively labels several serine hydrolases including ABHD6.The reaction products are analyzed as described for AID 602303.
Protocol Summary: Membrane proteome of Neuro-2A murine neuroblastoma cells (25 μL of 1 mg/mL) in Dulbecco’s PBS (DPBS) was treated with test compound (0.5 μL of a 50x stock in DMSO; 1 nM or 10 nM final concentration) or DMSO (0.5 μL) for 30 minutes at 37°C. The activity-based probe HT-01 (0.5 μL of a 50x stock in DMSO; 1 μM final concentration) was added, and the reaction was incubated for 30 minutes at 37°C, quenched with an equal volume of 2x SDS-PAGE loading buffer (reducing), separated by SDS-PAGE, and visualized by in-gel fluorescent scanning. The percentage of ABHD6 activity remaining was determined by measuring the integrated optical density of the individual protein bands relative to the DMSO-only (no compound) control. Assay Cutoff: Compounds with greater than or equal to 50% inhibition at 10 nM compound concentration were considered active.
Gel-based competitive ABPP inhibition of overexpressed anti-target DAGL-β in vitro (AIDs 602299 and 602300)
Assay Overview: The purpose of this assay is to determine whether test compounds can inhibit anti-target DAGL-β in a complex proteome using a gel-based ABPP assay. In this assay, DAGL-β is incubated with test compound followed by reaction with a fluorescently-labeled activity-based probe, HT-01 [9], which selectively labels several serine hydrolases including DAGL-β. The reaction products are analyzed as described for AID 602303.
Protocol Summary: Membrane proteome of transiently transfected 293T Hek cells overexpressing mouse DAGL-β (25 μL of 0.3 mg/mL) in Dulbecco’s PBS (DPBS) was treated with test compound (0.5 μL of a 50x stock in DMSO; 10 μM [AID 602299] or 1 μM [AID 602300] final concentration) or DMSO (0.5 μL) for 30 minutes at 37°C. The activity-based probe HT-01 (0.5 μL of a 50x stock in DMSO; 1 μM final concentration) was added, and the reaction was incubated for 30 minutes at 37°C, quenched with an equal volume of 2x SDS-PAGE loading buffer (reducing), separated by SDS-PAGE, and visualized by in-gel fluorescent scanning. The percentage of DAGL-β activity remaining was determined by measuring the integrated optical density of the individual protein bands relative to the DMSO-only (no compound) control. Assay Cutoff: Compounds with greater than or equal to 50% inhibition were considered active.
Gel-based competitive ABPP inhibition of overexpressed ABHD11 in vitro (AID 602312)
Assay Overview: The purpose of this assay is to determine whether test compounds can inhibit anti-target ABHD11 in a complex proteome using a gel-based competitive ABPP assay. In this assay, ABHD11 is spiked into a complex proteome and incubated with test compound followed by reaction with the ABPP probe FP-Rh. The reaction products are analyzed as described for AID 602303.
Protocol Summary: Membrane proteome of transiently transfected 293T Hek cells overexpressing mouse DAGL-β (25 μL of 0.3 mg/mL; Open Biosystems Accession BC016105) with added recombinant mouse ABHD11 (0.050 μM, Open Biosystems Accession BC069866) in Dulbecco’s PBS (DPBS) was treated with test compound (0.5 μL of a 50x stock in DMSO; 10 μM, 3.3 μM, 1 μM, or 0.3 μM final concentration) or DMSO (0.5 μL) for 30 minutes at 37°C. The activity-based probe FP-Rh (0.5 μL of a 50x stock in DMSO; 5 μM final concentration) was added, and the reaction was incubated for 30 minutes at 37°C, quenched with an equal volume of 2x SDS-PAGE loading buffer (reducing), separated by SDS-PAGE, and visualized by in-gel fluorescent scanning. The percentage of ABHD11 activity remaining was determined by measuring the integrated optical density of the individual protein bands relative to the DMSO-only (no compound) control.Assay Cutoff: Compounds with ≥50% inhibition were considered active.
Gel-based competitive ABPP inhibition of SHs in mouse brain membrane with FP-Rh (AIDs 602311 and 602321)
Assay Overview: The purpose of this assay is to assay test compound inhibition of serine hydrolases (SHs) using a gel-based competitive ABPP assay. In this assay, a complex proteome is incubated with test compound followed by reaction with the ABPP probe FP-Rh. The reaction products are analyzed as described for AID 602303.
Protocol Summary: Mouse brain membrane proteome (25 μL of 1 mg/mL in Dulbecco’s PBS [DPBS]) was treated with test compound (0.5 μL of a 50x stock in DMSO; 10 μM final concentration for AID 602311, 1 μM and 10 μM final concentration for AID 602321) or DMSO (0.5 μL) for 30 minutes at 37°C. The activity-based probe FP-Rh (0.5 μL of a 50x stock in DMSO; 1 μM final concentration) or HT-01 (0.5 μL of a 50x stock in DMSO; 1 μM final concentration) was added, and the reaction was incubated for 30 minutes at 37°C, quenched with an equal volume of 2x SDS-PAGE loading buffer (reducing), separated by SDS-PAGE, and visualized by in-gel fluorescent scanning. The percentage activity remaining for each SH was determined by measuring the integrated optical density of the individual protein bands relative to the DMSO-only (no compound) control. SHs with at least 50% inhibition by one or more compounds (FP-Rh: ABHD6, APEH, FAAH, KIAA1363, ABHD12, MAGL, LYPLA1, and LYPLA2; HT-01: DAGL-β, ABHD6, PLA2G7, and a SH with MW of 80kDa) are reported. Assay Cutoff: Compounds with greater than or equal to 50% inhibition for a given SH were considered active.
Gel-based competitive ABPP inhibition of ABHD6 and DAGL-β for IC50 determination in vitro (AID 602322)
Assay Overview: The purpose of this assay is to determine the IC50 values of powder samples of test compounds for ABHD6 and anti-target DAGL-β inhibition in a complex proteome lysate using a competitive ABPP assay. In this assay, the ABPP probe HT-01 is used to label a complex proteome natively expressing ABHD6 and anti-target DAGL-β in the presence of test compounds. The reaction products are analyzed as described for AID 602303.
Protocol Summary: Membrane proteome of Neuro-2A murine neuroblastoma cells (25 μL of 1 mg/mL) in Dulbecco’s PBS (DPBS) was treated with test compound (0.5 μL of a 50x stock in DMSO) or DMSO (0.5 μL) for 30 minutes at 37°C. The activity-based probe HT-01 (0.5 μL of a 50x stock in DMSO; 1 μM final concentration) was added, and the reaction was incubated for 30 minutes at 37°C, quenched with an equal volume of 2x SDS-PAGE loading buffer (reducing), separated by SDS-PAGE, and visualized by in-gel fluorescent scanning. The percentage activity remaining for ABHD6 and anti-target DAGL-β was determined by measuring the integrated optical density of the individual protein bands relative to the DMSO-only (no compound) control. IC50 values were determined from dose-response curves from three replicates at each inhibitor concentration (7-point 1:3 dilution series from either 3333 nM to 3.3 nM, 100 nM to 0.1 nM, or 100 nM to 0.033 nM). Note: inhibition of DAGL-β at each test concentration is also reported. Assay Cutoff: Compounds with an IC50 for ABHD6 less than or equal to 50 nM were considered active.
Gel-based competitive ABPP inhibition of SH anti-targets PNPLA6 and PLA2G15 in vitro (AID 602355)
Assay Overview: The purpose of this assay is to assay test compound inhibition of SHs using a gel-based competitive ABPP assay. In this assay, a complex proteome is incubated with test compound followed by reaction with the ABPP probe FP-Rh. The reaction products are analyzed as described for AID 602303.
Protocol Summary: The following proteome sources, prepared in Dulbecco’s PBS (DPBS), were used:PLA2G15: Membrane proteome of transiently transfected 293T Hek cells overexpressing mouse PLA2G15 (0.3 mg/mL). PNPLA6: Mouse brain membrane proteome (1 mg/mL). Proteome (25 μL) was treated with test compound (0.5 μL of a 50x stock in DMSO, 10, 2, 0.4, 0.08, 0.016, or 0.003 μM final concentration) or DMSO (0.5 μL) for 30 minutes at 37°C. The activity-based probe FP-Rh (0.5 μL of a 50x stock in DMSO; 1 μM final concentration) was added. The reaction was incubated for 30 minutes at 37°C, quenched with an equal volume of 2x SDS-PAGE loading buffer (reducing), separated by SDS-PAGE, and visualized by in-gel fluorescent scanning. The percentage activity remaining for each SH was determined by measuring the integrated optical density of the individual protein bands relative to the DMSO-only (no compound) control.Assay Cutoff: Compounds with greater than or equal to 50% inhibition for a given SH at 2 μM test compound concentration were considered active.
Gel-based competitive ABPP inhibition of ABHD6 and DAGL-β for IC50 determination in situ (AID 602335)
Assay Overview: The purpose of this assay is to determine the IC50 values of powder samples of test compounds for ABHD6 and anti-target DAGL-β inhibition in situ using a competitive ABPP assay. In this assay, the ABPP probe HT-01 is used to label ABHD6 and DAGL-β in the presence of test compounds. The reaction products are analyzed as described for AID 602303.
Protocol Summary: Cultured Neuro-2A murine neuroblastoma cells (5 mL DMEM medium with 10% FCS) were treated with test compound (1 μL of 5000x stock in DMSO) or DMSO only (1 μL) and incubated for 4 hours at 37°C. Cells were washed with DPBS (4x), harvested, and homogenized by sonication. The protein concentration was adjusted to 2 mg/mL with Dulbecco’s PBS (DPBS), and an aliquot (50 μL) was reacted with HT-01 (1 μL of a 50x stock in DMSO; 1 μM final concentration) for 30 minutes at 37°C. Samples were quenched with an equal volume of 2x SDS-PAGE loading buffer, separated by SDS-PAGE and visualized by in-gel fluorescent scanning. The percentage activity remaining was determined by measuring the integrated optical density of the ABHD6 and DAGL-β bands relative to the DMSO-only (no compound) control. IC50 values were determined from dose-response curves from three replicates at each inhibitor concentration (8-point 1:3 dilution series from 100 nM to 0.033 nM). Assay Cutoff: Compounds with an IC50 less than or equal to 50 nM were considered active.
Analysis of triazole urea cytotoxicity (AID 602337)
Assay Overview: The purpose of this assay is to determine cytotoxicity of powder samples of synthetic inhibitor compounds belonging to the triazole urea scaffold. In this assay, Neuro-2A murine neuroblastoma cells in either serum-free medium (Assay 1) or medium containing fetal calf serum (FCS) (Assay 2) are incubated with test compounds, followed by determination of cell viability. The assay utilizes the WST-1 substrate which is converted into colorimetric formazan dye by the metabolic activity of viable cells. The amount of formed formazan directly correlates to the number of metabolically active cells in the culture. As designed, compounds that reduce cell viability will result in decreased absorbance of the dye.
Protocol Summary: This assay was started by dispensing Neuro-2A murine neuroblastoma cells in DMEM medium supplemented with 10% FCS (100 μL, 15,000 cells/well) into a 96-well plate. Cells were incubated for 24 hours at 37°C in a humidified incubator, medium was removed, and 100 μL of fresh, serum-free medium (Assay 1) or medium supplemented with 10% FCS (Assay 2) was added. Compound (10 μL of 11x stocks in medium containing 10% DMSO) or an equal volume medium containing 10% DMSO only was added to each well. Cells were incubated for 48 hours at 37°C in a humidified incubator and cell viability was determined by the WST-1 assay (Roche) according to manufacturer instructions. CC50 values were determined from dose-response curves from six replicates at each inhibitor concentration (100, 50, 10, 1, 0.1, and 0.01 μM). Assay Cutoff: Compounds with CC50 values less than or equal to 1 μM were considered active (cytotoxic).
LC-MS/MS-based ABPP-SILAC analysis of selectivity in situ for ML295 (AID 602341)
Assay Overview: The purpose of this assay is to determine the selectivity profile of powder samples of test compounds using ABPP in combination with stable isotope labeling with amino acids in cell culture (SILAC) [10] as described [7, 9]. In this assay, cultured Neuro-2A cells are metabolically labeled with heavy or light amino acids. Heavy and light cells are treated with test compound and DMSO, respectively, in situ. Cells are lysed, proteomes are treated with the serine-hydrolase-specific activity-based fluorophosphonate-biotin (FP-biotin, [11]) affinity probe, and combined in a 1:1 (w/w) ratio. Biotinylated proteins are enriched, trypsinized, and analyzed by multi-dimensional liquid chromatography tandem mass spectrometery LC/LC-MS/MS (MudPIT) [12, 13]. Inhibition of target and anti-target activity is quantified by comparing intensities of light and heavy peptide peaks. As designed, compounds that act as inhibitors will block FP-biotin labeling, reducing enrichment in the inhibitor-treated (heavy) sample relative to the DMSO-treated (light) sample, giving a smaller heavy/light ratio for each protein. Proteins not targeted by inhibitors would be expected to have a ratio of 1.
Protocol Summary: Sample Preparation. Neuro-2A murine neuroblastoma cells were initially grown for 10 passages in either light or heavy SILAC DMEM medium supplemented with 10% dialyzed FCS and 2 mM L-glutamine. Light medium was supplemented with 100 ug/mL L-arginine and 100 ug/mL L-lysine. Heavy medium was supplemented with 100 ug/mL [13C615N4]-L-Arginine and 100 ug/mL [13C615N2]-L-Lysine. Heavy cells (in 10 mL medium) were treated with test compound (10 μL of a 1000x stock in DMSO; 25 nM final concentration) and light cells were treated with DMSO (10 μL) for 4 hours at 37°C. Cells were washed with DPBS (4x), harvested, and homogenized by sonication in DPBS. The soluble and membrane fractions were isolated by centrifugation (100K x g, 45 minutes) and the protein concentration for each fraction was adjusted to 2 mg/mL with DPBS. The light and heavy proteomes were labeled with the activity-based affinity probe FP-biotin (500 μL total reaction volume, 10 μM final concentration) for 2 hours at 25°C. After incubation, light and heavy proteomes were mixed in 1:1 ratio, and the membrane proteomes were additionally solubilized with 1% Triton-X100. Samples were desalted over PD10 columns (GE Healthcare) in DPBS, and biotinylated proteins enriched with streptavidin beads (50 μL beads; conditions: 1 hour, 25°C 0.5% SDS in DPBS). The beads were washed with 1% SDS in DPBS (1x), 6 M urea (1x), and DPBS (2x), then resuspended in in 6 M urea (150 μL), reduced with 5 mM TCEP for 20 minutes, and alkylated with 10 mM iodoacetamide for 30 minutes at 25°C in the dark. The urea concentration was reduced to 2 M with 2x volume DPBS. On-bead digestions were performed for 12 hours at 37°C with sequence-grade modified trypsin (Promega; 2 μg) in the presence of 2 mM CaCl2. Peptide samples were acidified to a final concentration of 5% (v/v) formic acid and stored at −80°C prior to analysis.
LC-MS/MS analysis. Samples were analyzed by multidimensional liquid chromatography tandem mass spectrometry (MudPIT) using an Agilent 1200-series quaternary pump and Thermo Scientific LTQ-Orbitrap Velos ion trap mass spectrometer. Peptides were eluted in a 5-step MudPIT experiment using 0%, 25%, 50%, 80%, and 100% salt bumps of 500 mM aqueous ammonium acetate and data were collected in data-dependent acquisition mode with dynamic exclusion turned on (20 seconds, repeat of 1). Specifically, one full MS (MS1) scan (400–1800 m/z) was followed by 30 MS2 scans of the most abundant ions. The MS2 spectra data were extracted from the raw file using RAW Xtractor (version 1.9.9.2; publicly available athttp://fields.scripps.edu/researchtools.php). MS2 spectra data were searched using the ProLuCID algorithm (publicly available at http://fields.scripps.edu/downloads.php) against the latest version of the mouse IPI database concatenated with the reversed database for assessment of false-discovery rates. ProLucid searches allowed for static modification of cysteine residues (+57.02146 due to alkylation), methionine oxidation (+15.9949), mass shifts of labeled amino acids (+10.0083 R, +8.0142 K) and no enzyme specificity. The resulting MS2 spectra matches were assembled into protein identifications and filtered using DTASelect (version 2.0.41, http://fields.scripps.edu/researchtools.php) using the –modstat, –mass, and –trypstat options (applies different statistical models for the analysis of high resolution masses, peptide digestion state, and methionine oxidation state respectively). Ratios of heavy/light (test compound/DMSO) peaks were calculated using in-house software and normalized at the peptide level to the average ratio of all non-serine hydrolase peptides. Reported ratios represent the mean of all unique, quantified peptides per protein and do not include peptides that were >3 standard deviations from the median peptide value. Proteins with less than three peptides per protein ID were not included in the analysis. Assay Cutoff: A compound was considered active for a particular target/anti-target with a light/heavy ratio of less than or equal to 0.5.
Gel-based competitive ABPP inhibition of ABHD6 in vivo (AID 602349, AID 624041, AID 602343, and AID 624077)
Assay Overview: The purpose of this assay is to determine whether or not powder samples of test compounds are active against ABHD6 in vivo using a gel-based competitive ABPP assay. In this assay, test compounds are administered to mice. Mice are sacrificed, and their brain and/or liver tissue is harvested, homogenized, and the membrane fraction isolated and reacted with either the ABPP probe FP-Rh or HT-01. The reaction products are analyzed as described for AID 602303.
Protocol Summary: Purpose-bred C57-black laboratory mice were administered test compound by either intraperitonial injection (i.p.) (1, 0.5, and 0.1 mg/kg for AID 602349; 20 and 5 mg/kg for AID 624041) or oral administration (p.o.) (10, 5, or 1 mg/kg for AID 602343 and AID 624077) or vehicle only (18:1:1 saline:PEG300:EtOH); n = 1 per group. After 4 hours, mice were humanely sacrificed (anesthetized with isoflurane and decapitated) and tissue (brain or liver) was removed and snap frozen in liquid nitrogen. Tissues were homogenized and the membrane fraction isolated by centrifugation (45 minutes, 100K x g) and adjusted to 1 mg/mL in DPBS. Aliquots (50 μL) were reacted with the activity-based probes HT-01 or FP-Rh (1 μL of a 50x stock in DMSO, 1 μM final concentration) for 30 minutes at 37°C. The reactions were quenched with an equal volume of 2x SDS-PAGE loading buffer (reducing), separated by SDS-PAGE and visualized by in-gel fluorescent scanning. The percentage activity remaining was determined by measuring the integrated optical density of test compound bands relative to vehicle bands. Assay Cutoff: Compounds with greater than or equal to 50% inhibition at 1 mg/kg compound (AID 602349), at 5 mg/kg compound (AID 624041), or 10 mg/kg compound (AIDs 602343 and 624077) were considered active.
LC-MS/MS-based ABPP-MudPIT analysis of selectivity in vivo for ML295 (AID 602351)
Assay Overview: The purpose of this assay is to determine the selectivity profile of powder samples of test compounds in vivo by ABPP in combination with the multidimensional protein identification technology (MudPIT) liquid chromatography tandem mass spectrometry (LC-M/MS) analysis platform [9, 14]. In this assay, mice are administered test compound or vehicle only. Mice are sacrificed, and primary macrophages removed, lysed, and reacted with the serine hydrolase specific activity-based fluorophosphonate-biotin (FP-biotin) affinity probe. Biotinylated proteins are enriched, trypsinized, and analyzed by MudPIT. Inhibition of target and anti-target activity is quantified by comparing spectra counts between the test compound- and DMSO-treated samples. As designed, compounds that act as inhibitors will block FP-biotin labeling, reducing enrichment in the inhibitor-treated sample relative to the DMSO-treated sample, thus giving a lower number of smaller spectra counts in the inhibitor treated sample. Proteins not targeted by inhibitors would be expected to have a spectra count ratio similar to DMSO control.
Protocol Summary: Sample Preparation. Purpose-bred C57-black laboratory mice, injected 4 days prior with thioglycollate, were administered test compound (5 mg/kg in 18:1:1 saline:PEG300:EtOH vehicle solution, i.p.) or vehicle only (n=3 per group). After 4 hours, mice were humanely sacrificed (anesthetized with isoflurane and decapitated) and primary macrophages were removed and snap frozen in liquid nitrogen. Macrophages were homogenized and the protein concentration for each lysate was adjusted to 2 mg/mL with DPBS. The macrophage proteomes were labeled with the activity-based affinity probe FP-biotin (500 μL total reaction volume, 10 μM final concentration) for 2 hours at 25°C. After incubation, the proteomes were additionally solubilized with 1% Triton-X100. Samples were desalted over PD10 columns (GE Healthcare) in DPBS, and biotinylated proteins enriched with streptavidin beads (50 μL beads; conditions: 1 hour, 25°C 0.5% SDS in DPBS). The beads were washed with 1% SDS in DPBS (1x), 6 M urea (1x), and DPBS (2x), then resuspended in 6 M urea (150 μL), reduced with 5 mM TCEP for 20 minutes, and alkylated with 10 mM iodoacetamide for 30 minutes at 25°C in the dark. The urea concentration was reduced to 2 M with 2x volume DPBS. On-bead digestions were performed for 12 hours at 37°C with sequence-grade modified trypsin (Promega; 2 ug) in the presence of 2 mM CaCl2. Peptide samples were acidified to a final concentration of 5% (v/v) formic acid and stored at −80°C prior to analysis.
LC-MS/MS analysis. Digested and acidified peptide mixtures were analyzed by two-dimensional liquid chromatography/tandem mass spectrometry (MudPIT) using an Agilent 1200-series quaternary pump and Thermo Scientific LTQ ion trap mass spectrometer. Peptides were eluted in a 5-step MudPIT experiment using 0%, 25%, 50%, 80%, and 100% salt bumps of 500 mM aqueous ammonium acetate, with chromatographic elution following each salt pulse accomplished using an increasing gradient of aqueous acetonitrile containing 0.1% formic acid over 125 minutes. Data were collected in data-dependent acquisition mode with dynamic exclusion turned on (90 s, repeat of 1). Specifically, one full MS (MS1) scan (400–1800 m/z) was followed by 7 MS2 scans of the most abundant ions. The MS2 spectra data were extracted from the raw file using RAW Xtractor (version 1.9.1; publically available at http://fields.scripps.edu/downloads.php). MS2 spectra data were searched using the PROLUCID algorithm (publically available athttp://fields.scripps.edu/downloads.php) against the latest version of the mouse UniProt database concatenated with the reversed database for assessment of false-discovery rates. PROLUCID searches allowed for variable oxidation of methionine (+16), static modification of cysteine (+57 due to alkylation), and no enzyme specificity. The resulting MS2 spectra matches were assembled into protein identifications and filtered using DTASelect (version 2.0.41) using the –trypstat and –modstat options, which apply different statistical models for the analysis of tryptic, half-tryptic, non-tryptic, and modified peptides. Spectra count abundance ratios (test compound/DMSO) were calculated for all serine hydrolases with an average of 10 or more spectra counts in the DMSO control samples, as well as for anti-target ABHD6, which had fewer spectra counts than the 10-count cutoff. A Student’s T-test (unpaired, equal variances) was utilized to determine statistical significance between the average spectra counts in compound vs. DMSO samples. Assay Cutoff: A compound was considered active for a particular target/anti-target if there was a statistical difference between the average spectra counts in the test compound- and DMSO-treated samples (P < 0.01).
2.2 Chemical Characterization of ML295, ML296, and Analog 12
CID 53364533
SID 125269138
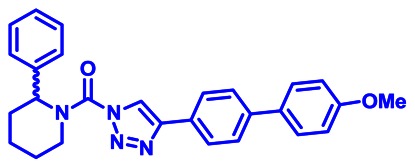
ML295
The probe structure of ML295 was verified by 1H NMR (see Section 2.3) and high resolution MS (m/zcalculated for C27H27N4O2 [M+H]+ 439.2129, found 439.2128). Purity was assessed to be greater than 95% by NMR.
CID 53364510
SID 125269096
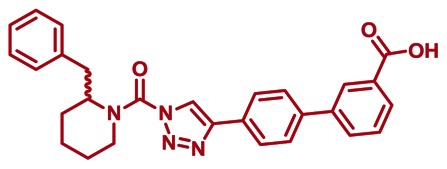
ML296
The probe structure of ML296 was verified by 1H NMR (see Section 2.3) and high resolution MS (m/zcalculated for C28H27N4O3 [M+H]+ 467.2078, found 467.2077). Purity was assessed to be greater than 95% by NMR.
CID 53364491
SID 125269091
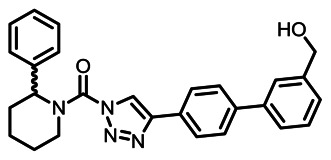
Analog 12 (KT182)
The structure of analog 12 was verified by 1H NMR (see Section 2.3) and high resolution MS (m/z calculated for C27H27N4O2 [M+H]+ 439.2128, found 439.2116). Purity was assessed to be greater than 95% by NMR.
It should be noted that ML295, ML296, and analog 12 were synthesized in racemic form, and the independent activity of each enantiomer has not yet been tested. Future work may address this issue through the design of a chiral synthetic route or via chiral separation of the two enantiomers.
Solubility (room temperature) for ML295, ML296 and analog 12 was determined to be <1 μM in PBS forML295 and 12 and 26.8 μM for ML296, but much higher in DMEM medium containing 10% fetal calf serum (3.2 μM for ML295, 84.5 μM for ML296, and 17.2 μM for 12). The latter buffer conditions are more relevant to biological experiments (complex proteome or cell-based studies in serum-containing medium), and we have not found the modest solubility to be a hindrance for biological application. The solubility difference between medium with and without serum was, however, evident in the cytotoxicity analysis of ML295, with the serum-free conditions causing clear anomalies in the observed cytotoxicity outcome On that note, some anti-target selectivity data collected for ML295 at 10 μM compound concentration should be treated with some caution given the lower solubility limits; however, potential anti-targets of ML295 were re-evaluated at lower (sub-solubility-limiting) concentrations to verify selectivity. Furthermore, all cell-based potency and SILAC-ABPP profiling studies were conducted with compound concentrations below solubility limits. Stability in PBS forML295, ML296 and analog 12 was determined to be >48 hours.
Table 1Compounds submitted to the SMR collection (04-09-2012)
| Designation | CID | SID | SRID | MLS |
|---|---|---|---|---|
| Probe 1 | CID 53364533 | SID 125269138 | SR-02000001774-1 | MLS004256815 |
| Analog 1 | CID 53364459 | SID 125269101 | SR-02000001737-1 | MLS004256816 |
| Analog 2 | CID 53364460 | SID 125269133 | SR-02000001769-1 | MLS004256817 |
| Analog 3 | CID 53364554 | SID 125269137 | SR-02000001773-1 | MLS004256818 |
| Analog 4 | CID 53364482 | SID 125269142 | SR-02000001778-1 | MLS004256819 |
| Analog 5 | CID 53364492 | SID 125269143 | SR-02000001779-1 | MLS004256820 |
| Probe 2 | CID 53364510 | SID 125269096 | SR-02000001732-1 | MLS004256821 |
| Analog 1 | CID 53364555 | SID 125269136 | SR-02000001772-1 | MLS004256822 |
| Analog 2 | CID 53364491 | SID 125269091 | SR-02000001727-1 | MLS004256823 |
| Analog 3 | CID 53364552 | SID 125269139 | SR-02000001775-1 | MLS004256824 |
| Analog 4 | CID 53364468 | SID 125269140 | SR-02000001776-1 | MLS004256825 |
| Analog 5 | CID 53364515 | SID 125269141 | SR-02000001777-1 | MLS004256826 |
2.3 Probe Preparation
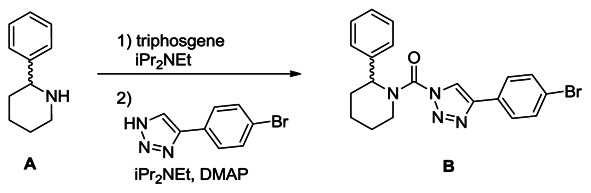
Synthesis of (4-(4-bromophenyl)-1H-1,2,3-triazol-1-yl)(2-phenylpiperidin-1-yl)methanone (B): A solution of racemic 2-benzyl piperidine (A, 0.42 g, 2.6 mmol) in THF (8 mL) was treated with iPr2NEt (1.4 ml, 7.8 mmol) and triphosgene (0.39 g, 1.3 mmol), and the reaction mixture was stirred for 30 minutes at 4°C. The mixture was poured into H2O and extracted with ethyl acetate. The organic layer was washed with H2O and brine, dried over Na2SO4 and concentrated under reduced pressure. The intermediate was dissolved in THF (10 mL), and iPr2NEt (1.4 ml, 7.8 mmol), DMAP (0.32 g, 2.6 mmol) and 4-(4-bromophenyl)-1H-1,2,3-triazole (0.60 g, 2.6 mmol) were added to the solution. The mixture was stirred for 2 hours at 60°C and poured into saturated aqueous NH4Cl solution. The mixture was extracted with ethyl acetate, washed with H2O and brine, dried over Na2SO4 and concentrated under reduced pressure. Chromatography (60 g, ethyl acetate:hexane=1:6) afforded triazole urea B (450 mg, 42%). 1H NMR (CDCl3, 400 MHz) δ 8.40 (s, 1H), 7.75 (d, 2H, J = 8.5 Hz), 7.58 (d, 2H, J = 8.5 Hz), 7.43-7.26 (m, 5H), 5.91 (br, 1H), 4.36 (brd, 1H, J = 13.6 Hz), 3.18 (m, 1H), 2.52 (brd, 1H, J = 14.2 Hz), 2.15 (m, 1H), 1.90-1.60 (m, 4H). HRMS calculated for C20H20BrN4O [M+H]+ 411.0815, found 411.0802.
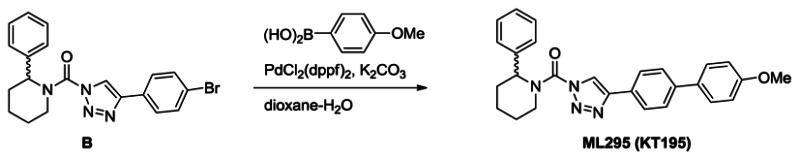
Synthesis of ML295 (KT195): A solution of triazole urea B (100 mg, 0.24 mmol) in dioxane (4 mL) and H2O (0.4 mL) was treated with 4-methoxyphenyl bronic acid (55 mg, 0.37 mmol), K2CO3 (100 mg, 0.72 mmol) and PdCl2(dppf) (18 mg, 0.024 mmol), and the reaction mixture was stirred for 2 hours at 80°C under N2. The mixture was poured into H2O and extracted with ethyl acetate. The organic layer was washed with H2O and brine, dried over Na2SO4 and concentrated under reduced pressure. Chromatography (50g, ethyl acetate:hexane=1:5~1:4) afforded ML295 (70 mg, 66%). 1H NMR (CDCl3, 400 MHz) δ 8.42 (s, 1H), 7.93 (d, 2H, J = 8.3 Hz), 7.65 (d, 2H, J = 8.3 Hz), 7.58 (d, 2H, J = 8.8 Hz), 7.43-7.26 (m, 5H), 7.00 (d, 2H, J = 8.8 Hz), 5.94 (br, 1H), 4.78 (brd, 1H, J = 13.8 Hz), 3.19 (brt, 1H, J = 13.8 Hz), 2.54 (brd, 1H, J = 13.8 Hz), 2.16 (m, 1H), 1.91-1.60 (m, 4H), purity >95%. HRMS calculated for C27H27N4O2 [M+H]+ 439.2129, found 439.2128. The triazole substitution of ML295 as the 1,4-isomer was determined by NMR comparison to known 1,4- and 2,4-substitiuted isomers, as reported in ref. [9].
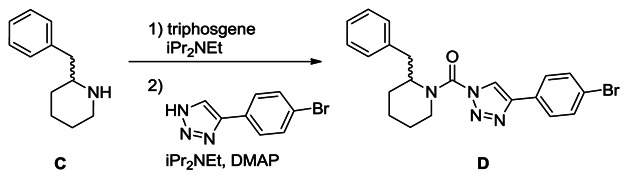
Synthesis of (2-benzylpiperidin-1-yl)(4-(4-bromophenyl)-1H-1,2,3-triazol-1-yl)methanone (D): A solution of racemic 2-benzyl piperidine (C, 0.32 g, 1.8 mmol) in THF (15 mL) was treated with iPr2NEt (0.95 mL, 5.4 mmol) and triphosgene (0.27 g, 0.9 mmol), and the reaction mixture was stirred for 30 minutes at 4°C. The mixture was poured into water and extracted with ethyl acetate. The organic layer was washed with water and brine, dried over Na2SO4 and concentrated under reduced pressure. The intermediate was dissolved in THF (20 mL), and iPr2NEt (0.95 mL, 5.4 mmol), DMAP (218 mg, 1.8 mmol) and 4-(4-bromophenyl)-1H-1,2,3-triazole (0.40 g, 1.8 mmol) were added to the solution. The mixture was stirred for 2 hours at 60°C and poured into saturated aqueous NH4Cl solution. The mixture was extracted with ethyl acetate, washed with water and brine, dried over Na2SO4 and concentrated under reduced pressure. Chromatography (70 g, ethyl acetate:hexane=1:6~1:5) afforded D (320 mg, 42%). 1H NMR (CDCl3, 400 MHz) δ 7.72-7.54 (m, 4H), 7.45-6.89 (m, 6H), 5.29 (br, 1H), 4.34 (brd, 1H, J = 13.5 Hz), 3.42-3.10 (m, 2H), 2.67 (br, 1H), 2.04-1.60 (m, 6H). HRMS calculated for C21H22BrN4O [M+H]+ 425.0971, found 425.0976. The triazole substitution of D (a.k.aKT116) as the 1,4-isomer was determined by X-ray crystallography, as reported in ref. [9].
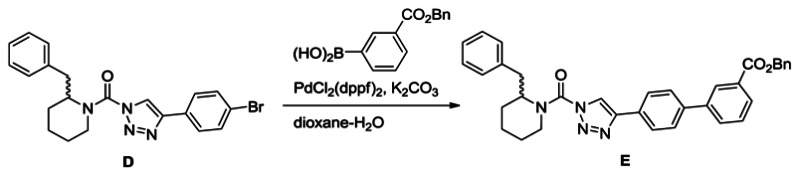
Synthesis of benzyl 4′-(1-(2-benzylpiperidine-1-carbonyl)-1H-1,2,3-triazol-4-yl)-[1,1′-biphenyl]-3-carboxylate (E): A solution of urea (1.2 g, 2.9 mmol) in dioxane (40 mL) and H2O (4 mL) was treated with 3-carboxybenzylphenyl boronic acid (1.1 g, 4.4 mmol), K2CO3 (1.2 g, 8.7 mmol) and PdCl2(dppf) (0.11 g, 0.15 mmol), and the reaction mixture was stirred for 2 h at 80°C under N2. The mixture was poured into H2O and extracted with ethyl acetate. The organic layer was washed with H2O and brine, dried over Na2SO4 and concentrated under reduced pressure. Chromatography (150 g, ethyl acetate:hexane=1:3) afforded E (1.6 g, quant.). 1H NMR (CDCl3, 300 MHz) δ 8.36 (s, 1H), 8.08 (d, 1H, J = 7.5 Hz), 7.89 (br, 2H), 7.84 (d, 1H, J = 7.3 Hz), 7.71 (d, 2H, J = 8.4 Hz), 7.56-7.33 (m, 6H), 7.30-6.90 (m, 5H), 5.42 (s, 2H), 4.86 (br, 1H), 4.37 (d, 1H, J = 13.3 Hz), 3.48-2.69 (m, 3H), 2.05-1.65 (m, 6H). HRMS calculated for C35H32N4O3 [M+H]+ 557.2547, found 557.2552.
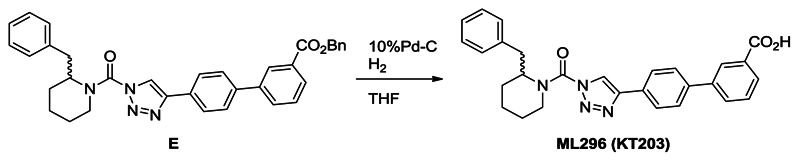
Synthesis of ML296 (KT203): A solution of E (1.6 g, 2.9 mmol) in THF (30 mL) was treated with 10%Pd-C (0.30 g) and the mixture was stirred for overnight at room temperature under N2. The mixture was passed through Celite and the filtrate was concentrated under reduced pressure. Crystallization from ethyl acetate and hexane afforded ML296 (1.2 g, 89%). 1H NMR (CDCl3, 300 MHz) δ 8.41 (s, 1H), 8.12 (d, 1H, J = 7.8 Hz), 7.95-7.84 (m, 3H), 7.73 (d, 2H, J = 8.3 Hz), 7.59 (t, 1H, J = 7.8 Hz), 7.50-6.95 (m, 5H), 5.30 (br, 1H), 4.37 (brd, 1H, J = 13.8 Hz), 3.48-2.60 (m, 3H), 2.05-1.65 (m, 6H), purity >95%. HRMS calculated for C28H27N4O3[M+H]+ 467.2078, found 467.2077.
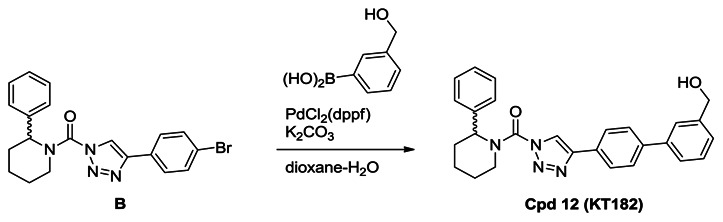
Synthesis of Compound 12 (KT182): A solution of urea (0.70 g, 1.7 mmol) in dioxane (30 mL) and H2O (3 mL) was treated with 3-hydroxymethylphenyl bronic acid (0.39 g, 2.6 mmol), K2CO3 (0.70 g, 5.1 mmol) and PdCl2(dppf) (62 mg, 0.085 mmol), and the reaction mixture was stirred for 2 hours at 80°C under N2. The mixture was poured into H2O and extracted with ethyl acetate. The organic layer was washed with H2O and brine, dried over Na2SO4 and concentrated under reduced pressure. Chromatography (150 g, ethyl acetate:hexane=1:1) afforded compound 12 (0.55 g, 74%). 1H NMR (CDCl3, 300 MHz) δ 8.44 (s, 1H), 7.96 (d, 2H, J = 8.3 Hz), 7.70 (d, 2H, J = 8.3 Hz), 7.65 (s, 1H), 7.58 (m, 1H), 7.48-7.25 (m, 7H), 5.93 (br, 1H), 4.78 (br, 2H), 4.38 (brd, 1H, J = 13.5 Hz), 3.19 (m, 1H), 2.53 (brd, 1H, J = 14.1 Hz), 2.16 (m, 1H), 1.90-1.65 (m, 4H), purity >95%. HRMS calculated for C27H27N4O2 [M+H]+ 439.2128, found 439.2116. The triazole substitution of compound 12 as the 1,4-isomer was determined by NMR comparison to known 1,4- and 2,4-substitiuted isomers, a reported in ref. [9].
3 Results
3.1 Dose Response Curves for Probe
ABHD6 IC50 values for ML295, ML296, and analog 12 were obtained from gel-based competitive-ABPP data using the HT-01 activity-based probe, which labels a handful of serine hydrolases, enabling enhanced visualization of select bands vs. use of the more widely reactive FP-Rh probe [9], both in vitro (AID 602322) and in situ (AID 602335) as shown in Figure 1. As mentioned above, one of the primary reasons ML295 was chosen as the ABHD6 control anti-probe for the dual DAGL-β/ABHD6 inhibitor ML294 was its similar potency for ABHD6 as compared to that of ML294 for DAGL-β (IC50s of 38 vs. 56 nM in vitro, 1.3 vs. 12 nM in situ, for ML295 and ML294, respectively, see ML294 Probe Report). Of note, the peripheral probe ML296 and the systemic inhibitor 12 are very well matched in terms of potency both in vitro (IC50s of 0.82 and 1.7 nM) andin situ (IC50s of 0.31 and 0.24 nM), making them ideal companion tools for analysis of restricted ABHD6 inhibition.

3.2 Cellular Activity
In situ Inhibition: Probes ML295 (SID 125269138) and ML296 (SID 125269096) are active in situ (AID 602335) as assessed by gel-based competitive ABPP following 4 hours of compound incubation with Neuro-2A murine neuroblastoma cells (cultured in medium containing 10% fetal calf serum). These results indicate that members of the triazole urea class of compounds are free to cross cell membranes and inhibit their targets in cells at nM and sub-nM concentrations.
In vivo Inhibition: We first assessed the in vivo inhibition and selectivity of probe ML295 (SID 125269138,AID 624041). For this experiment, mice (n=1 per group) were administered test compound (5 or 20 mg/kg, i.p.) or vehicle only. After 4 hours, mice were sacrificed and their liver tissue removed. The membrane fraction was isolated and subject to gel-based competitive ABPP with the SH-specific ABPP probe FP-Rh. Near-complete inhibition of ABHD6 is observed for ML295 at both test concentrations, and a clean selectivity profile of more than 15+ SH enzymes is obtained at 5 mg/kg. At the higher dosage, there is apparent inhibition of a ca. 72kDa band (possibly a carboxylesterase), suggesting that lower dosing (5 mg/kg) is desirable for maintenance of full potency and high selectivity. These data indicate that ML295 exhibits high selectivity in vivo, a finding further confirmed by more in-depth LC-MS/MS ABPP MudPIT profiling.
Cytotoxicity: ML295 (SID 125269138) and ML296 (SID 125269096) were evaluated for cytotoxicity (AID 602337) in Neuro-2A murine neuroblastoma cells cultured in both serum-supplemented and serum-free medium. For the more soluble compound ML296, the results of the two experiments were fairly consistent, giving CC50 values of ~13 μM, significantly above determined IC50 values (< 1 nM), thus providing a suitably large dosing window. For the low solubility probe ML295 (<1 μM in PBS, 3.2 μM in serum-supplemented medium), the results of the two experiments were quite different, with the serum-free conditions yielding a 15-fold elevated value (CC50s >100 μM) vs. the serum-supplemented experiment (CC50s of 5.9 μM). As such, the results of the serum-supplemented experiment are likely a more accurate reflection of cytotoxicity due to poor solubility in the serum-free medium. For ML295, even if we set a lower CC50 threshold at the compound’s solubility limit (3.2 μM), the dosing window is still extremely large (>2000-fold) vs. the in situIC50 value vs. ABHD6 of 1.3 nM. Given these results, overt compound cytotoxicity should not present a problem for biological studies.
3.3 Profiling Assays
Gel-based Competitive ABPP: This medium-throughput proteome-wide screening technique was instrumental in our medchem optimization of the probe compound, allowing rapid assessment of potency and selectivity among SHs (including lipases, esterases, proteases, and uncharacterized hydrolases), as visualized by disappearance of bands in compound-treated lanes relative to the DMSO-only control. It should be noted that gel-based profiling gives us access to fairly low abundant proteins. For example, we have previously determined that we could detect the SH FAAH at concentrations as low as 0.0005% of the total proteome (~200 copies per cell) by gel-based ABPP [15].
HTS Analysis. No HTS activity data are yet available for probes ML295 or ML296 or any of the synthetic analogs, nor have the probe compounds and analogs been submitted for commercial or non-commercial broad panel screening. Rather, the reactivity of the triazole urea compound class has been extensively characterized using competitive ABPP methods, as described below.
Reactivity of triazole ureas outside the SH enzyme class. As detailed in the Probe Report for ML225 and in ref. [7], we previously completed an analysis of triazole urea reactivity outside of the SH class by gel-based competitive ABPP using alkyne-functionalized triazole urea compounds. For these experiments, we assessed whether or not the proteome reactivity profiles of the alkynyl triazole ureas of moderate electrophilicity (akin to the SAR series in Section 3.4) could be blocked by pre-incubation with the non-fluorescent SH-directed activity based probe FP-biotin [11] with visualization of labeled proteins achieved by click chemistry conjugation of the alkyne-functionalized triazole ureas to an azido-conjugated rhodamine reporter tag [16]. FP-biotin was found to successfully compete all proteins modified by the triazole ureas, indicating that the latter reacted exclusively with members of the SH class; as such, anti-targets outside of the SH class are not a primary concern for ML295, ML296, or analog 12.
Reactivity of triazole ureas within the SH enzyme class: Probes ML295 (SID 125269138) and ML296 (SID 125269096) and analogs have been subject to gel-based competitive ABPP screening to assess SH reactivity against more than 20 FP-sensitive SHs visible by 1D SDS-PAGE separation and fluorescent detection in the mouse brain membrane proteome (AID 602311 and AID 602321). This proteome was chosen due to its relevance for future study of ABHD6 in the nervous system as well as its diversity of SHs. Compound treatment (10 μM for AID 602311, 1 and 10 μM for AID 602321, 30 minutes) was followed by labeling with FP-Rh (30 minutes), SDS-PAGE, and in-gel visualization. Anti-target hits are identified by ≥50% disappearance of the band in the gel relative to the DMSO control. ML295 shows a clean selectivity profile at 10 μM, but was re-evaluated (AID 602355) to confirm selectivity at sub-saturating concentrations; with clean selectivity at 2 μM, ML295 is >50-fold selective vs.20+ mouse brain membrane SHs (vs. in vitro IC50 of 38 nM).
ABPP-SILAC: To more comprehensively identify potential anti-targets, we utilized an advanced quantitative mass spectrometry (MS)-based platform termed competitive ABPP-SILAC (AID 602341). Competitive ABPP-SILAC [7, 9] combines competitive ABPP [17] with stable isotope labeling of cells (SILAC) [10], and allows for precise quantitation of enzyme inhibition by calculating the isotopic ratios of peptides from inhibitor-treated and control cells. We estimate that the sensitivity of a standard LC-MS/MS based assay (e.g., ABPP-SILAC, ABPP-MudPIT) is at least 10-fold higher than our gel-based assays (0.00005% of the total cell proteome, or 20 copies per cell). As such, this method offers more sensitive detection of low abundance SHs for a comprehensive selectivity analysis. The results demonstrate that ML295 displays high selectivity for ABHD6in situ, blocking >90% of activity while not affecting activity of 40+ other SHs. This clean selectivity profile highlights the value of specific chemotypes, like the triazole ureas, from which it is possible to derive potent and selective enzyme inhibitors.
ABPP-MudPIT: To more comprehensively identify potential anti-targets of ML295 in vivo, we utilized a quantitative LC-MS/MS-based platform termed competitive ABPP-MudPIT (AID 602351) [14]. ABPP-MudPIT allows for semi-quantitative determination of enzyme inhibition via comparison of the spectra counts of peptides from control vs. inhibitor-treated samples. The results demonstrate that ML295 exhibits significant selectivity for ABHD6 (P<0.01).
4 Discussion
4.1 Comparison to Existing Art and How the New Probe is an Improvement
We have previously developed selective ABHD6 inhibitors WWL70 (IC50 70 nM) [18] and WWL123 (IC50 430 nM) [19] based on a carbamate scaffold (Figure 2). However, the triazole urea probes reported herein are both significantly more potent (IC50s of 38 nM and 0.8 nM for ML295 and ML296, respectively) and show much better activity in vivo. WWL70 has only been characterized in vitro and in situ (e.g., [6, 18, 20]), but not in animal models. WWL123 does have demonstrated inhibitory activity in the murine brain in vivo, but is only active at high (20 mg/kg) dosage [19]. In contrast, ML295 and ML296 can achieve complete inhibition of ABHD6 in the liver at 5 mg/kg and 0.5 mg/kg, respectively. ML296 is also the first reported peripherally-restricted ABHD6 inhibitor.
As an additional concern for ML295, for development of an ABHD6 anti-probe for the dual DAGL-β/ABHD6 inhibitor ML294, it was important that the control probe be as similar to ML294, in terms of structure, physical properties, potency, and selectivity, as possible. As such, the existing carbamate inhibitors would serve as poor controls given their dissimilar structures and potency; potential catabolism of carbamate compounds in the liver, which is not a problem with the triazole ureas was also a concern. Therefore, the triazole urea ABHD6 inhibitors are a key addition to the arsenal of chemical tools for investigating EC metabolism in vivo.
5 References
- 1.
- Di Marzo V. Targeting the endocannabinoid system: to enhance or reduce? Nat. Rev. Drug Discov.2008;7(5):438–55. [PubMed]
- 2.
- Chevaleyre V, Takahashi KA, Castillo PE. Endocannabinoid-mediated synaptic plasticity in the CNS.Annu. Rev. Neurosci. 2006;29:37–76. [PubMed]
- 3.
- Ahn K, McKinney MK, Cravatt BF. Enzymatic pathways that regulate endocannabinoid signaling in the nervous system. Chem. Rev. 2008;108(5):1687–707. [PMC free article] [PubMed]
- 4.
- Ahn K, et al. Mechanistic and pharmacological characterization of PF-04457845: a highly potent and selective fatty acid amide hydrolase inhibitor that reduces inflammatory and noninflammatory pain. J. Pharmacol Exp. Ther. 2011;338(1):114–24. [PMC free article] [PubMed]
- 5.
- Blankman JL, Simon GM, Cravatt BF. A comprehensive profile of brain enzymes that hydrolyze the endocannabinoid 2-arachidonoylglycerol. Chem. Biol. 2007;14(12):1347–56. [PMC free article] [PubMed]
- 6.
- Marrs WR, et al. The serine hydrolase ABHD6 controls the accumulation and efficacy of 2-AG at cannabinoid receptors. Nat. Neurosci. 2010;13(8):951–7. [PMC free article] [PubMed]
- 7.
- Adibekian A, et al. Click-generated triazole ureas as ultrapotent in vivo-active serine hydrolase inhibitors.Nat. Chem. Biol. 2011;7(7):469–78. [PMC free article] [PubMed]
- 8.
- Hsu KL, Cravatt BF. Manuscript in preparation. :2012.
- 9.
- Hsu KL, Tsuboi K, Adibekian A, Cravatt BF. DAGLB Regulates an Endocannabinoid-Eicosanoid Network Involved in Macrophage Inflammatory Responses. 2012. Submitted.
- 10.
- Ong SE, et al. Stable isotope labeling by amino acids in cell culture, SILAC, as a simple and accurate approach to expression proteomics. Mol. Cell Proteomics. 2002;1(5):376–86. [PubMed]
- 11.
- Liu Y, Patricelli MP, Cravatt BF. Activity-based protein profiling: the serine hydrolases. Proc. Natl. Acad. Sci. U. S. A. 1999;96(26):14694–9. [PMC free article] [PubMed]
- 12.
- Washburn MP, Wolters D, Yates JR 3rd. Large-scale analysis of the yeast proteome by multidimensional protein identification technology. Nat. Biotechnol. 2001;19(3):242–7. [PubMed]
- 13.
- Wolters DA, Washburn MP, Yates JR 3rd. An automated multidimensional protein identification technology for shotgun proteomics. Anal. Chem. 2001;73(23):5683–90. [PubMed]
- 14.
- Jessani N, et al. A streamlined platform for high-content functional proteomics of primary human specimens. Nat. Methods. 2005;2(9):691–7. [PubMed]
- 15.
- Jessani N, et al. Enzyme activity profiles of the secreted and membrane proteome that depict cancer cell invasiveness. Proc. Natl. Acad. Sci. U. S. A. 2002;99(16):10335–40. [PMC free article] [PubMed]
- 16.
- Speers AE, Cravatt BF. Profiling enzyme activities in vivo using click chemistry methods. Chem. Biol.2004;11(4):535–46. [PubMed]
- 17.
- Leung D, et al. Discovering potent and selective reversible inhibitors of enzymes in complex proteomes.Nat. Biotechnol. 2003;21(6):687–91. [PubMed]
- 18.
- Li W, Blankman JL, Cravatt BF. A functional proteomic strategy to discover inhibitors for uncharacterized hydrolases. J. Am. Chem. Soc. 2007;129(31):9594–5. [PubMed]
- 19.
- Bachovchin DA, et al. Superfamily-wide portrait of serine hydrolase inhibition achieved by library-versus-library screening. Proc. Natl. Acad. Sci. U. S. A. 2010;107(49):20941–6. [PMC free article] [PubMed]
- 20.
- Straiker A, et al. Monoacylglycerol lipase limits the duration of endocannabinoid-mediated depolarization-induced suppression of excitation in autaptic hippocampal neurons. Mol. Pharmacol. 2009;76(6):1220–7.[PMC free article] [PubMed]