

Optimizing cannabidiol delivery methods: This study aims to improve CBD’s solubility and permeability for better health benefits.
Optimising Cannabidiol Delivery: Improving Water Solubility and Permeability Through Phospholipid Complexation
Abstract
1. Introduction
2. Results and Discussion
2.1. Quantification of CBD

2.2. Dynamic Light Scattering (DLS)
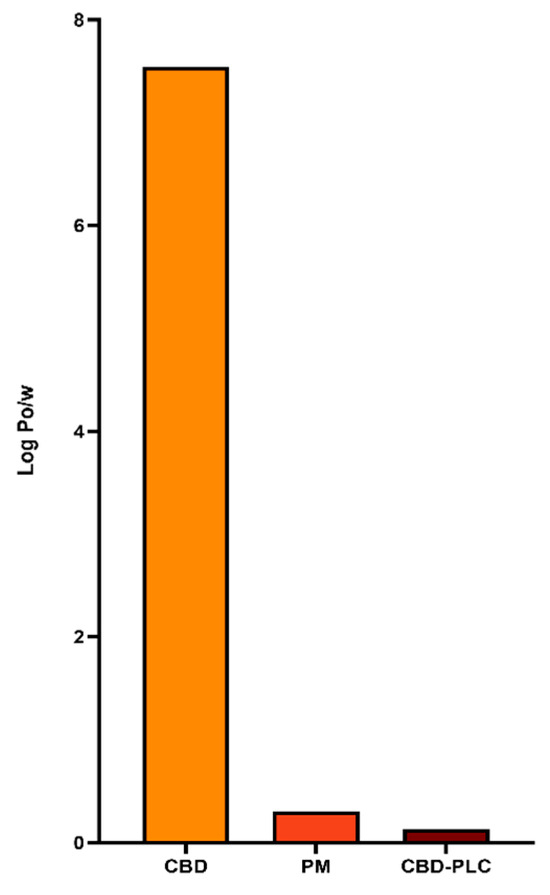
2.3. Lipophilicity Evaluation (N-Octanol/Water Partition Coefficient)

2.4. Preliminary Study for Selection of PL and Design of Experiments (DoE)
2.5. SEM
2.6. Encapsulation Efficiency (EE)
2.7. Ultraviolet (UV) Spectra

2.8. Differential Scanning Calorimetry (DSC)

2.9. Fourier Transform Infrared Spectrometry (FTIR)


Principal Components Analysis (PCA) for FTIR

2.10. 1HNMR


-
PL: Peaks at 4.4025 ppm (intensity: 6.16 × 10⁻¹), 4.1574 ppm (1.80 × 10⁻¹), 3.9972 ppm (4.60 × 10⁻¹), and 3.9123 ppm (4.82 × 10⁻¹).
-
PM: Peaks at 4.4587 ppm (1.99 × 10⁻¹), 4.3388 ppm (9.82 × 10⁻²), 4.2625 ppm (4.33 × 10⁻¹), 4.0880 ppm (1.64 × 10⁻¹), and 3.9136 ppm (1.99 × 10⁻¹).
-
CBD-PLC: Peaks at 4.4805 ppm (5.02 × 10⁻²), 4.4369 ppm (4.23 × 10⁻²), 4.3497 ppm (1.49 × 10⁻¹), 4.2516 ppm (4.84 × 10⁻¹), and 4.0662 ppm (2.56 × 10⁻¹).
-
CBD: Peaks at 4.5940 ppm (1.85) and 3.9095 ppm (4.79 × 10⁻¹).
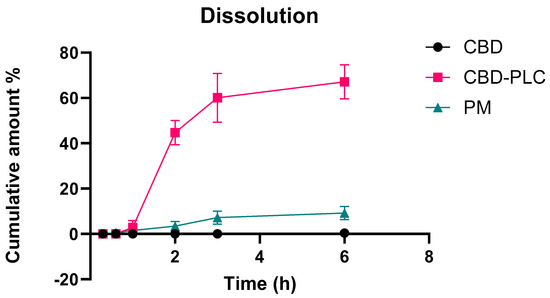
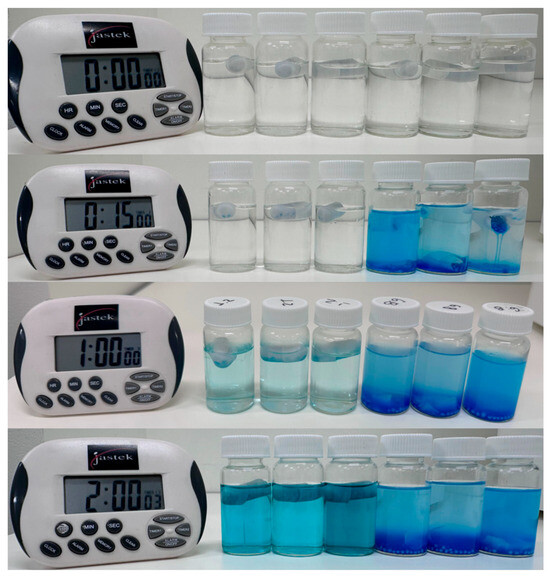
2.11. In Vitro Drug Dissolution Study

2.12. Stability Study
2.13. Intestinal Cell Monolayer Preparation and Treatment
2.13.1. Assessment of Cell Viability in Caco-2 Cells

2.13.2. Cell Viability and Transepithelial Electrical Resistance (TEER) Assay


3. Materials and Methods
3.1. Materials/Chemical and Reagents
3.2. Quantification of CBD by HPLC Method
3.3. Quantification of CBD by LC-MS Method
3.4. Preparation of CBD-PLC
3.5. Preliminary Study for Selection of PL
3.6. DLS
3.7. CBD Lipophilicity Evaluation (N-Octanol/Water Partition Coefficient)
The solubility profile of CBD-PLC was investigated by adding 100 ± 10 mg of the complex into sealed Falcon tubes containing 5 mL of PBS (pH 6.8), MilliQ water, or n-octanol [68]. The tubes were subjected to gentle agitation on an orbital shaker at room temperature (23 ± 0.5 °C) for a 24 h duration away from light, followed by centrifugation at 3000 rpm for 10 min. The supernatant was subsequently filtered (0.45 μm) and diluted with methanol (1:1) before analysis via HPLC. The Po/w and its logarithmic form (log Po/w) are important indicators of the solubility and bioavailability properties of the compounds tested. In this study, three samples (CBD, PM, and CBD-PLC) were evaluated for their partitioning behaviour between octanol and water. The formulas used are as follows:
3.8. Design of Experiments
3.9. SEM
3.10. EE
Approximately 10 mg of CBD-PLC was mixed with 1 mL of acetonitrile in an Eppendorf tube. The mixture was then vortexed for 1 h at low speed using a multi-tube vortex mixer (Melbourne, Australia) [19,70,71]. The samples were then centrifuged at 16,100 rcf for 20 min, resulting in a clear supernatant. This supernatant was filtered through a 0.45 μm syringe filter (PVDF). The results were calculated using the equations described below:
3.11. UV Spectra
3.12. DSC
DSC was performed using a DSC250 (TA Instruments, New Castle, DE, USA) to evaluate the onset temperature, melting point, width of melting events (WME), enthalpy, and crystallinity index (CI) of the pure drug, PM, PL, and CBD-PLC. Approximately 3 mg of each sample was sealed in an aluminium pan and analysed from 25 to 200 °C at a ramp rate of 10 °C/min. Nitrogen was used as a purge gas at a flow rate of 50 mL/min. The WME and CI were calculated using the following equations:
3.13. FTIR Spectroscopy
PCA of FTIR Spectra
3.14. H-NMR
3.15. In Vitro Drug Dissolution Study
3.16. Stability Study
-
Intermediate conditions at 25 °C with 60% relative humidity, devoid of light exposure;
-
Accelerated conditions at 40 °C with 75% relative humidity;
-
Long-term storage conditions at 4 °C, ensuring optimal preservation.
3.17. Intestinal Cell Monolayer Preparation and Treatment
3.17.1. Assessment of Cell Viability in Caco-2 Cells
3.17.2. Permeation Study and TEER Assay
Caco-2 cells were seeded on Transwell™ polyester membrane cell culture inserts (transparent PET membrane: 1.0 cm2 growth surface area, 0.4 μm pore size; BD Falcon™) in 12-well plates from Merck Pty Ltd. (Sydney, Australia). Cell cultures were maintained at 37 °C, 95% relative humidity and 5% CO2. The culture medium was changed every second day. Cells were seeded at a density of 3 × 10⁵ and cultivated for a minimum of 21 days to reach confluency and ensure monolayer differentiation. The integrity of the Caco-2 monolayer was established by measuring TEER across the monolayer using an EVOM2 (World Precision Instruments, Sarasota, FL, USA). The experiment was initiated via the addition of CBD-PLC and CBD (10–50 µM) diluted in PBS in the apical chamber. At predetermined time intervals, 1–3–6–24 h, transport buffer was removed from the apical and basal chamber and immediately replaced with fresh pre-warmed media. Collected aliquots were appropriately diluted with methanol prior to LC-MS analysis, as described previously. All experiments were performed in triplicate, and the data are presented as the mean ± standard error [66,76]. Papp and % recovery were calculated using the below equations:
where:
-
dQ/dT: the permeability rate.
-
A: the surface area of the cell monolayer.
-
C0: the initial concentration in the donor compartment.
-
Vr: the solution volume in the receiver chamber.
-
Vd: the volume in the donor chambers.
-
Cd and Cr: the final concentrations of transport compound in donor and receiver chambers, respectively.
4. Conclusions
Supplementary Materials
Author Contributions
Funding
Institutional Review Board Statement
Informed Consent Statement
Data Availability Statement
Acknowledgments
Conflicts of Interest

Revolutionary Research on the ECS, cannabinoids and cannabis-based medicine for healthcare from a trusted nonprofit.
